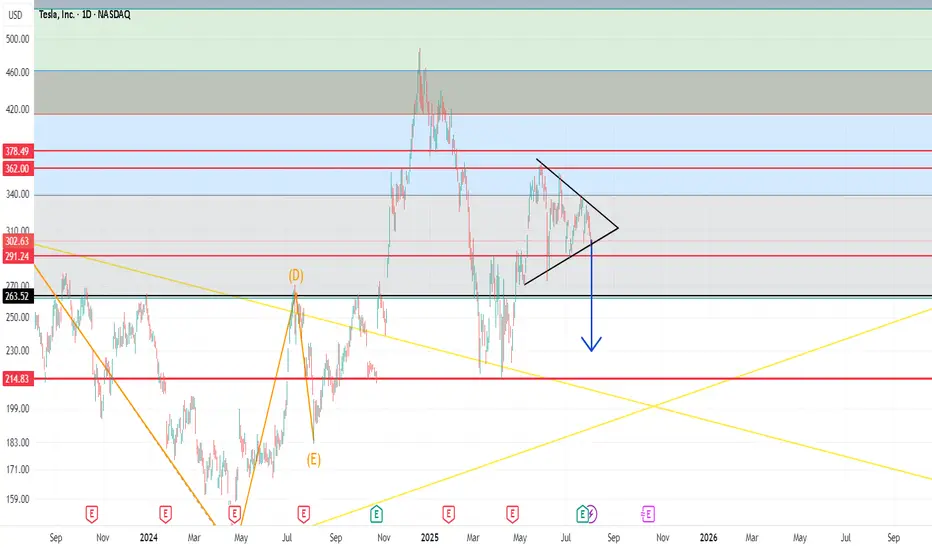
Long TESLATrading Fam,
Today my indicator has signaled a BUY on $TSLA. The technicals align. M pattern looks to have completed at strong support (RED TL) and is bouncing upwards inside of a solid liquidity block. Buyers are stepping in. I'm in at $315 and will shoot for $430 (probably taking some profit along the way). My SL is currently $241 but will trail as we enter profit.
Best,
Stew
TL0 trade ideas

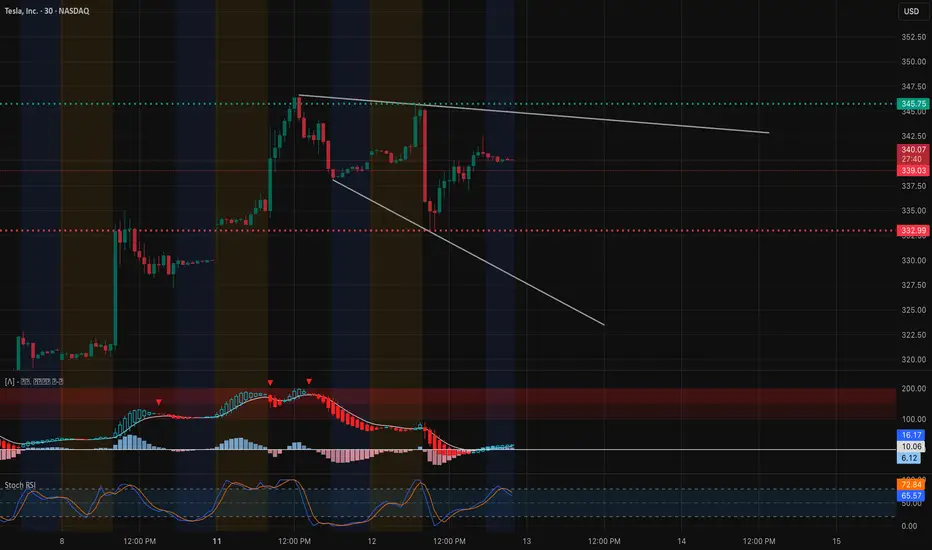
TSLA – TA + GEX Confluence for August 13, 202530-Minute Price Action
TSLA remains inside a descending triangle after an earlier breakout attempt toward $345.75.
* Resistance: $345.75 – repeated rejections, forming the triangle’s upper boundary.
* Support: $339.03 – near-term floor; $332.99 – key downside pivot.
* Indicators:
* MACD is attempting to recover from negative territory, showing early momentum shift but still lacking strong follow-through.
* Stoch RSI in the mid-to-high zone — room for continuation up if buyers push through resistance, but also vulnerable to a quick fade if rejected.
1-Hour GEX Insights
* Highest Positive NET GEX / Gamma Wall: $350 – strongest upside resistance zone.
* Key Call Walls Above: $347.5 (2nd gamma wall), $350 (primary wall), $355–$357.5 (3rd wall).
* Put Support: $327.5 (first gamma support) and $320 (major downside defense).
* IVR: 4.7 – very low implied volatility rank, making long options relatively cheap.
TA + GEX Combined Read
The 30m descending triangle structure is pressing TSLA into a decision point.
* The $345.75 resistance aligns closely with the $347.5 GEX wall — meaning bulls need strong volume to break out.
* A breakout above $347.5 opens a cleaner path toward the $350 gamma wall, where heavy hedging could either cap price or trigger a gamma squeeze to $355+.
* A failure to clear $345.75 combined with a break below $339 could invite sellers to push toward $332.99 and possibly $327.5 GEX support.
Trading Scenarios for August 13
* Bullish Breakout: Long calls or debit spreads above $347.5 targeting $350–$355.
* Bearish Breakdown: Puts or put spreads if $339 breaks, targeting $333 and $327.5.
* Sideways/Neutral: Credit spreads in the $339–$347 range could work given low IVR, but expect volatility if $347.5 breaks.
Reasoning
The 30m chart’s descending triangle suggests consolidation before a larger move. The 1h GEX data confirms the critical nature of $347.5 and $350. A breach above these could accelerate buying via gamma squeeze mechanics, while a breakdown under $339 targets deeper GEX supports.
Disclaimer: This analysis is for educational purposes only and does not constitute financial advice. Always do your own research and manage risk appropriately before trading.
TSLA, Beyond the candlesPrice is bouncing off the support zone where a previous rebound signal was triggered.
A short-term overbought signal is more likely to appear if the market rallies sharply in the near term, but recent momentum in equities looks weak.
Adding a layer of technical analysis.

TSLA: We're in a rangeLet's put it this way, we aren't going below $260.
Fo those that have been accumulating since 2022, patience has been a virtue. It may continue to be one. However, I can confidentially say, I think $815 is a mix term target. Long term... The sky is the limit.
I have my reasons for my investments.
If you want to or don't want to invest that's up to you and more power to you.
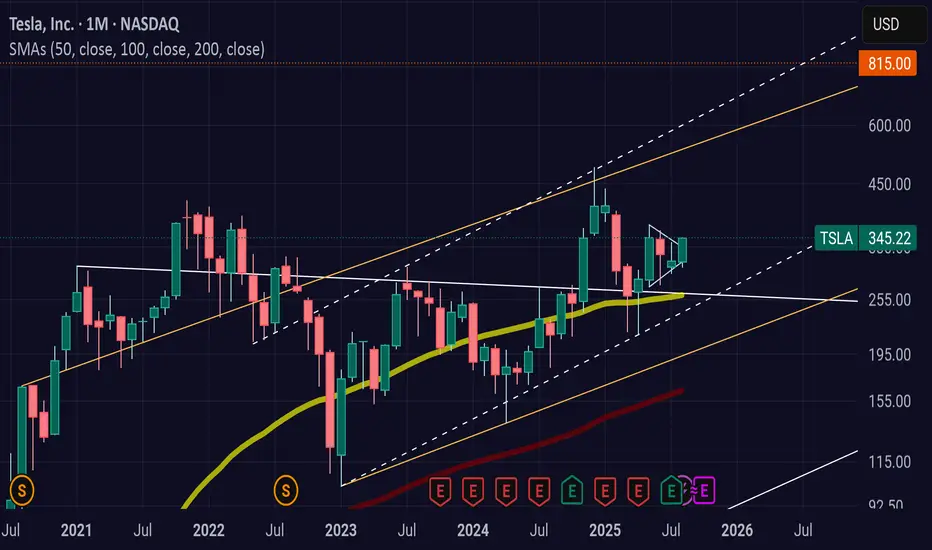
Sitting Right on the 200-Day EMATSLA is sitting right on the 200-Day EMA here while holding this wedge for quite some time. TSLA's Bollinger Bands are starting to squeeze, indicating a significant move is forthcoming, and moving averages (MA 5/10/30/60) are flattening, indicating a loss of bullish momentum. It will be interesting to watch from here.

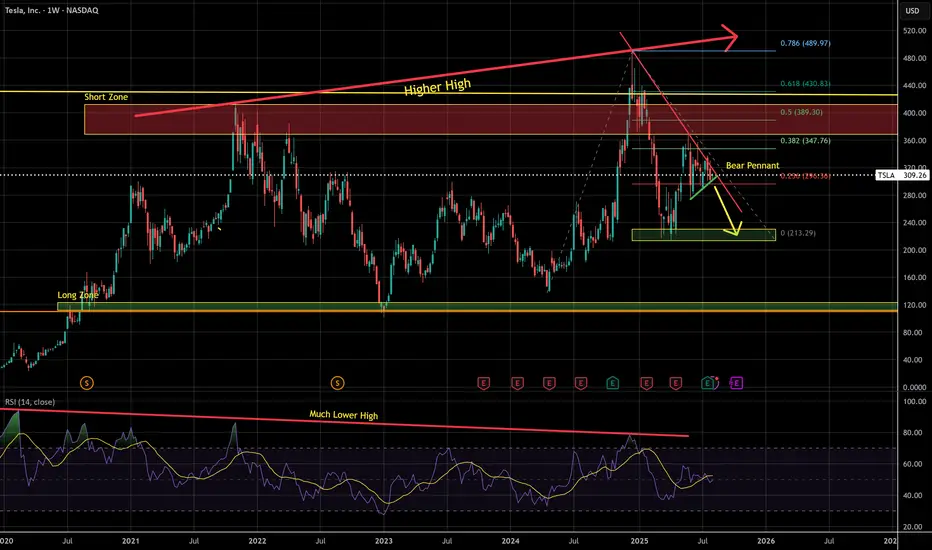
Bearish Pennant & Long Term Bearish DivergenceBearish pennant formed and sharp bearish divergence on the RSI, Elon personally receiving billions from the pockets of the company. This alludes to possible instability on the inside, despite being up a significant amount this year. Companies are like icebergs, cracks on the surface run deep, negative information is repressed.
In my opinion, a drawdown of over 25% seems in order
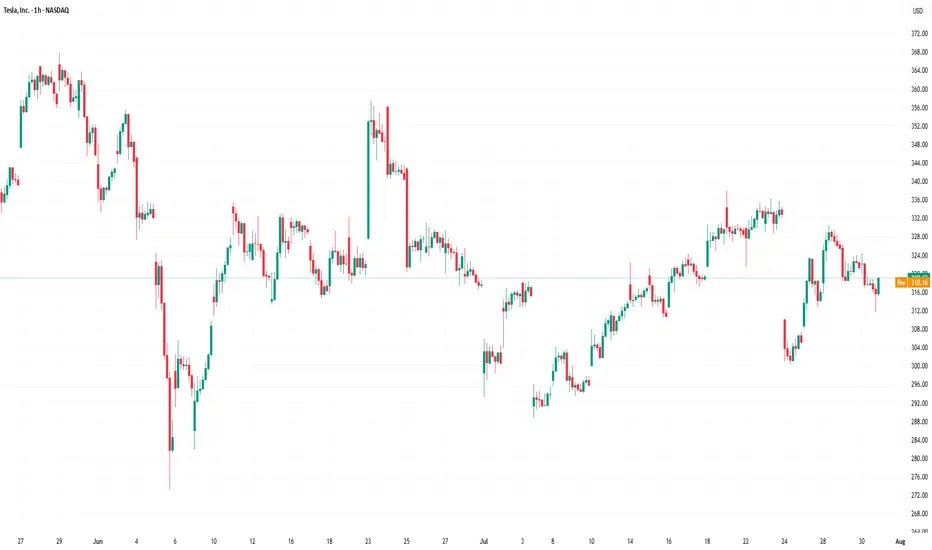
TSLA Attempting Breakout – Watching $312 Key Level. Aug. 5TSLA Attempting Breakout – Watching $312 Key Level 🚀
Technical Overview (1H)
TSLA is consolidating just below the critical $312 resistance, aligning with the Highest Positive GEX and 2nd Call Wall (57.55%). A breakout above this level could trigger a gamma squeeze toward $317.5 and potentially $325.
Support sits at $300 (Major Put Support -58.42%). If this fails, bears could push toward $295 and $290. Price is currently forming a falling wedge, a bullish reversal pattern if confirmed.
GEX & Options Flow Insights
* Highest Positive GEX: $312 – Strong resistance; breaking above can fuel upside momentum.
* Major Call Walls: $317.5, $325 – Profit-taking zones for bulls.
* Major Put Support: $300 – Bears will defend here; losing it invites heavier selling.
* Call/Put Positioning: CALLs 31.3% vs Puts – Skew still leans slightly bullish, but gamma flip is near $300.
My Thoughts
TSLA is coiling for a potential move. As long as price holds above $300, the risk/reward still favors a bullish breakout play. However, failure to clear $312 could see a pullback into $305–$300 range before another attempt.
Trade Ideas
Bullish Scenario:
* Entry: On a breakout above $312 with strong volume
* Targets: $317.5 → $325
* Stop-Loss: Below $305
Bearish Scenario:
* Entry: Rejection at $312 and loss of $305
* Targets: $300 → $295
* Stop-Loss: Above $315
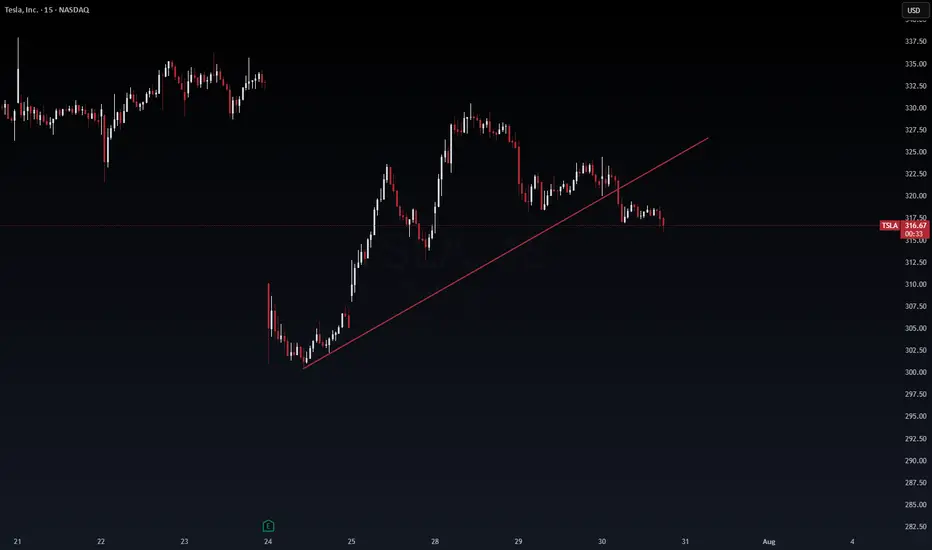
15-Minute Short-Term Setup
* Intraday traders should watch for a mini breakout retest above $310 for scalps to $312+.
* If $307 fails intraday, momentum could stall toward $304–$302.
Disclaimer: This analysis is for educational purposes only and does not constitute financial advice. Always do your own research and manage your risk before trading.
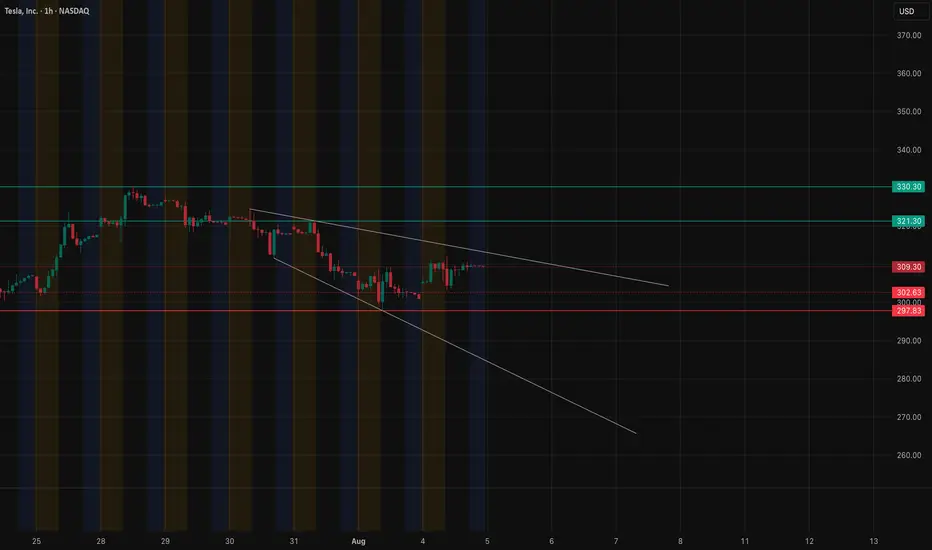
TSLA LONGQuite a simple set up. Confirmation is still needed on 3d, and daily. Bullish candles and volume is desperately needed for validation of symmetrical setup.
Volatility incoming. Break of ATH with strength leads to price discovery into $500+.

TSLA LONGAccumulating tesla shares - $300 is a very interesting area for TSLA, Looks like as long as we hold this area we should see $500 by end of year... much sooner.

Tesla (TSLA) – VolanX Forecast: The Calm Before the Storm?📊 Tesla (TSLA) – VolanX Forecast: The Calm Before the Storm?
Wave structure analysis + liquidity map + roadmap to $513
🧩 The Story So Far – Compressed Potential
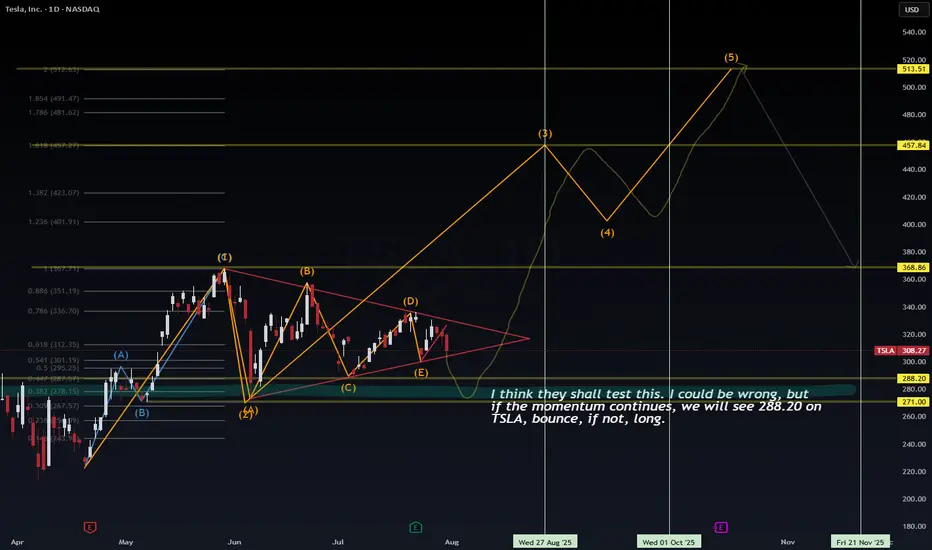
Tesla has spent the past three months inside a contracting triangle (ABCDE) — a classic Elliott Wave corrective pattern that signals energy compression before expansion. From the May high (Wave (1)), price has been coiling within tightening range boundaries, forming lower highs and higher lows. The triangle culminates with leg (E), now hovering near support.
🟠 VolanX flags this as a terminal wedge—an area where institutions test both sides of the book, hunting liquidity.
🌀 Wave Forecast – Impulse Awakening
If the triangle completes as expected, we enter Wave (3)—typically the most explosive wave in Elliott sequences.
Here's how the projected roadmap unfolds:
Wave (2) ends around $288.20–$271.00 (key demand/liquidity zone)
Wave (3) initiates from this springboard, aiming toward:
📈 1.0 Fib Extension at $367.71
📈 1.618 Extension at $457.84
Consolidation expected at that level forms Wave (4)
Final thrust into Wave (5) targets $513.51, aligning with extended Fib projection and historical order block
This sequence respects classical Elliott impulse structure: 5-wave motive into macro target zone.
🧪 Timing & Liquidity – Watch the Clock, Watch the Flow
🗓 Key Windows from chart verticals:
Aug 27–Sep 1, 2025: Liquidity test at $288.20 zone
Oct 1–15, 2025: Expansion toward Wave (3)
By mid-November 2025: Completion of Wave (5) → exhaustion at $513 zone before probable macro retracement
🔍 Liquidity Zones:
$288.20 – Institutional reaccumulation level (VolanX confirms large resting bids)
$271.00 – Final sweep zone. Break below would invalidate bullish count
Above, $336.70–$351.19 is the first liquidity magnet
Major stops above $457.84, then final cluster $513.51
🧠 VolanX Opinion – AI View on Risk & Opportunity
VolanX signals high-probability breakout setup, with confluence across:
Liquidity clusters
Fibonacci symmetry
Elliott sequencing
Gamma positioning (institutional hedging tilts long below $290)
📈 Current predictive bias: 68% probability of breakout from triangle resolving bullishly, conditional on $288 support holding.
If tested and respected, AI favors aggressive repositioning in long gamma, echoing historical TSLA breakout behavior.
📌 Strategy Summary:
“I think they shall test this… I could be wrong. But if momentum holds, $288.20 bounce is likely. If not, wait for structure to rebuild before long.”
🧭 Trade Setup (Not Financial Advice):
Watch zone: $288–271
Confirmation: Strong rejection wick + volume delta flip
Stop: Below $267.57
Targets: $367.71 → $457.84 → $513.51
🔻 Risk comes from invalidation below $271.
⚡ Reward stems from recognizing compression before expansion.
#TSLA #VolanX #ElliottWave #LiquiditySweep #WaveAnalysis #FibonacciLevels #SmartMoney #OptionsFlow #TeslaForecast #AITrading #WaverVanir
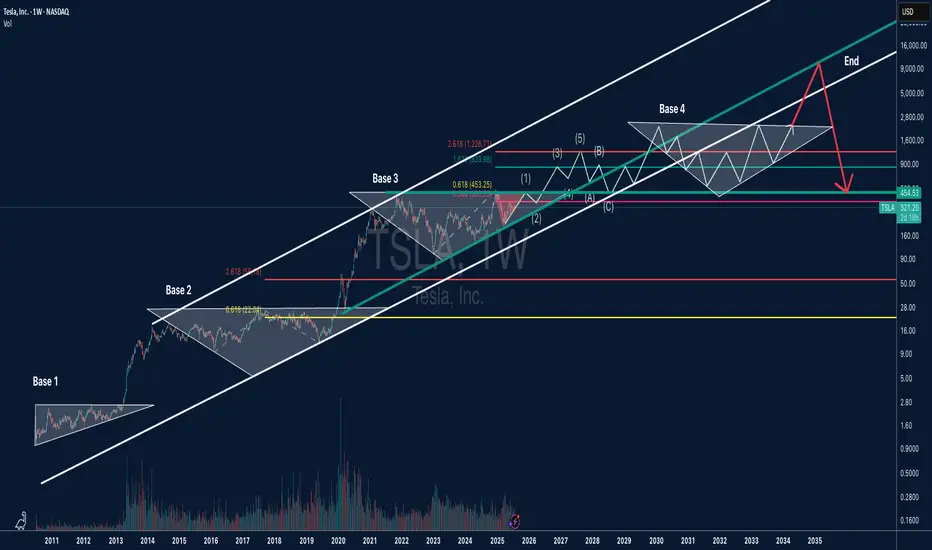
TSLA Long-Term Bold Projection (2025-2035)This is a long-term analysis of Tesla (TSLA) stock on the weekly timeframe, combining Elliott Wave Theory, Fibonacci extensions, and price structure (base formations) within a broad logarithmic trend channel.
Key Highlights:
🔹 Base Formations:
Base 1 (2010–2013): First consolidation before TSLA’s breakout.
Base 2 (2014–2019): A wide triangle structure leading to explosive growth.
Base 3 (2021–2024): Ongoing range suggesting wave (2) correction.
Base 4 (2026–2032): Projected future range before a possible euphoric blow-off phase.
🔹 Elliott Wave Structure:
Current wave count suggests TSLA is finishing wave (2) of a larger 5-wave structure.
Bullish impulse expected with wave (3), (4), and (5) leading to new ATHs, potentially into the $8,000–$10,000+ range.
A corrective ABC phase may follow, bringing price back toward key support (~$450 zone), aligned with Fibonacci retracements and channel support.
🔹 Fibonacci Levels:
0.618 and 2.618 extensions align with historical breakout points and future resistance zones.
Long-term projection targets include $1,226, $4,400, and potentially $8,000+, with eventual reversion to the mean.
🔹 Log Channel:
Price has respected a long-term ascending channel.
Midline and upper resistance bands guide potential future resistance zones.
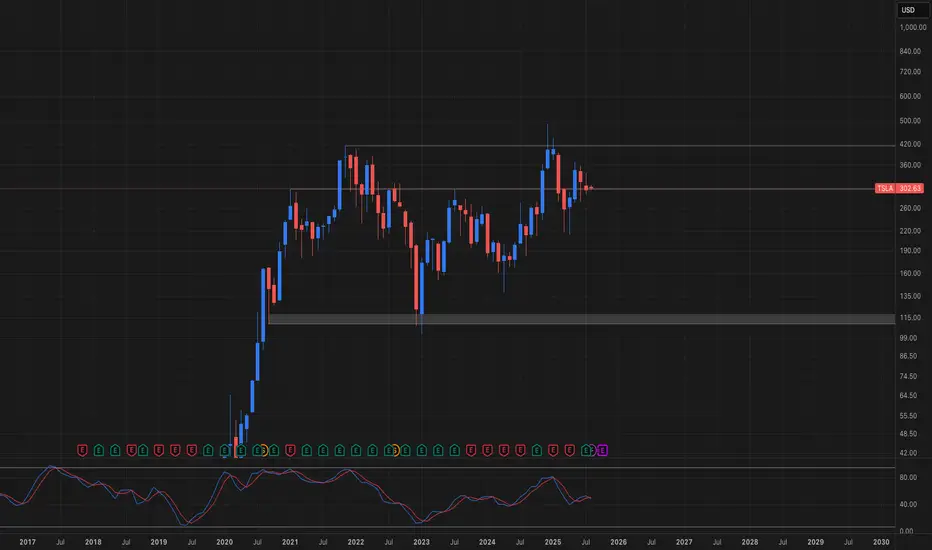
Don’t Be Surprised to See $TSLA at $100/Share Down the LineTesla ( NASDAQ:TSLA ) has spent the last 5 years ranging between $100 and $300, with only two spikes — November 2021 and December 2024 — both of which failed to hold above $400. Structurally, this is a long-term range stock at this point.
Unless we see breakout with volume above the $400 level, the odds still favor a continued range. Long-term investors and traders should remain open to the idea of a retest toward the bottom of the channel ($100) — especially if Tesla's financials’s face pressure.
TSLA: Here is what I see in TSLA"Zoom In. Follow the Sequence."
Just analyzing sequential wave patterns across multiple timeframes.
You can zoom in and see how structure evolves — impulse, correction, then continuation.
Maybe there’s a strategy here that repeats. Maybe not.
But if there is... it’s worth finding.

TSLA Weekly Bearish Play — August 2, 2025
🔻 **TSLA Weekly Bearish Play — August 2, 2025** 🔻
🚨 **Multi-Model Consensus Signals a Tactical Put Opportunity**
### 🔍 Market Snapshot:
* **Daily RSI:** 39.9 (Bearish)
* **Weekly RSI:** 53.2 → Falling
* **Volume:** Weak (0.8x last week)
* **Options Flow:** Neutral (C/P Ratio \~1.04)
* **VIX:** 20.38 → Favorable for Options Plays
* **Institutional Support:** Weak
---
### 🔮 Model Consensus:
📉 **All major models (xAI, Google, Claude, Meta, DeepSeek)** confirm:
* Bearish momentum on both daily + weekly RSI
* Weak volume = cautious institutional behavior
* Volatility setup perfect for short-dated puts
---
### 🎯 Viral Trade Setup:
**💥 Trade Type:** PUT (Short TSLA)
**🔻 Strike:** \$300
**📆 Expiry:** 2025-08-08
**💰 Entry Price:** \$6.65
**🎯 Target Exit:** \$10.64 – \$13.30 (60%-100% gain)
**🛑 Stop Loss:** \$3.99
**📊 Confidence:** 65%
**📍 Entry Timing:** Monday open
**🕒 Signal Timestamp:** 2025-08-03 01:33:56 EDT
---
### ⚠️ Key Levels:
* Support to watch: **\$297.82**
* News/event risks: Stay alert ⚡
* Use tight risk controls for weekly plays!
---
🔥 **If you trade TSLA — don’t sleep on this one.**
Bearish consensus + clean setup = **high-probability weekly play.**

Bearish Triangle: TSLAWaiting for TSLA to breakout 292 to form a bearish triangle pattern.
Target price: 22X
Make or Break point for TSLAlots of bulls and bears for TSLA. Wedging for a bit now. Filled the 296 gap and gap above, now its time to see if TSLA wants up or down. RSI MACD stabilized, volume thinned out, so whatever direction it chooses I think will be explosive. Plenty of Call and Put flow on both sides.
TESLA: Bullish Continuation & Long Trade
TESLA
- Classic bullish setup
- Our team expects bullish continuation
SUGGESTED TRADE:
Swing Trade
Long TESLA
Entry Point - 302.63
Stop Loss - 296.98
Take Profit - 312.87
Our Risk - 1%
Start protection of your profits from lower levels
Disclosure: I am part of Trade Nation's Influencer program and receive a monthly fee for using their TradingView charts in my analysis.
❤️ Please, support our work with like & comment! ❤️

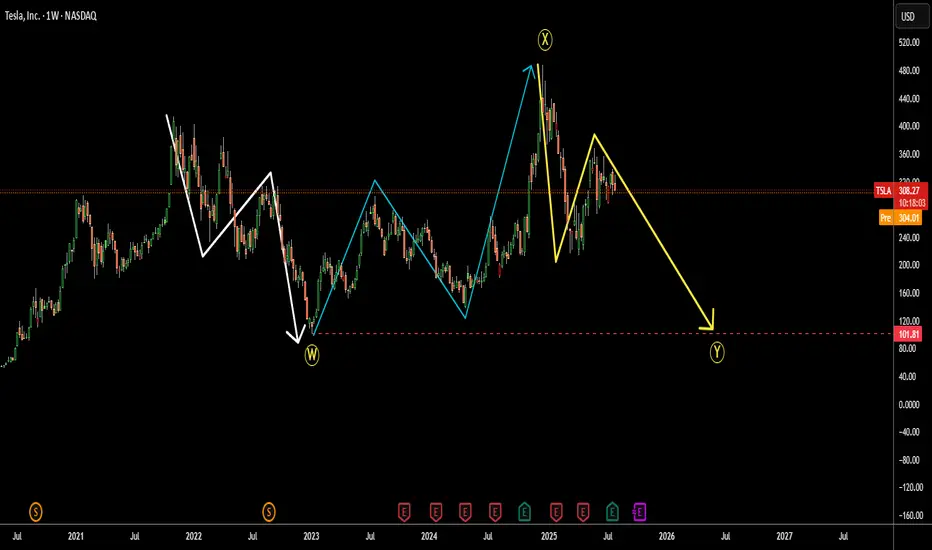
Tesla (TSLA) Crash Ahead? $101.81 Retest in SightThe Tesla price chart appears to show a large flat correction labeled W-X-Y.
Wave W consists of three downward waves from 2021 to 2023. (white)
Wave X shows a three-wave upward retracement from 2023 to 2024, which even overshot the start of wave W. (blue)
Now, we seem to be in the final leg of the third move: wave Y down. (yellow)
Typically, wave Y retests the bottom of wave W.
If that holds, we could see Tesla’s price revisit the 2023 low of $101.81.
Is Tesla losing its appeal?
I’d love to hear your thoughts.
WXY structure with a double topTesla has been in a uptrend with a corrective structure WXY. I am not sure if the WXY is a part of wave 5 terminal structure or a B wave. However expecting a double top or 78.6 retrace to 425-430 range as a minimum. For this scenario, an impulsive upside move is expected within the next few weeks. However the price needs to move back into the channel next week as a first step.

TSLA: Watching for short. I think there might be sell off, looking at the chart. I could be wrong so ll observe for now. I will go in if the momentum towards downward accelerate.
TSLA: 308.27Bullish Entries: 312.00/318.00 Stop 316.00 / Target 322.00–325.00
Bearish Entries: 304.00/300.00 Stop 302.00 / Target 296.00–292.00. Note: If the open starts above 312.00, we should wait for it to touch 318.00. Then, 320.00 is the entry for the previous day's bearish trend reversal and the new uptrend.

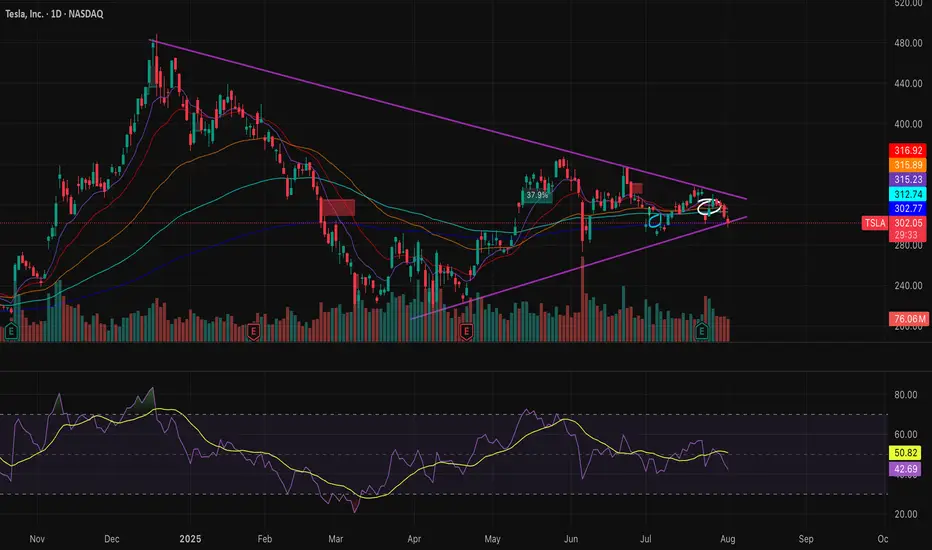
TSLA Breakout Watch: Symmetrical Triangle Squeeze!Trade Summary
Setup: Symmetrical triangle pattern tightening since March; volatility compression signals an imminent breakout.
Entry: On daily close above the triangle resistance (~$324)
Stop‑loss: Below triangle support (~$305)
Targets:
• Target 1: $375
• Long-term: $500+
Risk/Reward: ~2.5–3:1 (Initial target), higher for long-term hold
Technical Rationale
📈 Symmetrical triangle: Clear converging trendlines; price nearing apex after months of higher lows and lower highs
🔔 Volatility squeeze: Range compression increases odds of explosive move
⏳ Daily timeframe: Signals a swing/position trade opportunity with significant upside
Catalysts & Context
⚡️ Earnings season ahead could trigger a breakout
🌱 EV sector momentum and renewed tech leadership
🏦 Analyst upgrades and potential for macro rate cuts
Trade Management Plan
Entry: Wait for a daily close and volume confirmation above $324 resistance
Stop-loss: Tight initial stop below $305; trail to breakeven after breakout confirmation
Scaling: Partial profits at $375; let remainder run for $500+ if momentum continues
Poll
What’s your view? Are you watching TSLA? Comment below or vote:
🔼 Bullish
🔽 Bearish
🔄 Waiting for confirmation
Follow us for daily high-probability setups & real-time trade updates!
Disclaimer: Not financial advice. Trade at your own risk.

Fibonacci Arcs in Stock TradingFibonacci Arcs in Stock Trading
Fibonacci arcs, derived from the renowned Fibonacci sequence, offer a compelling blend of technical analysis and market psychology for traders. By mapping potential support and resistance areas through arcs drawn on stock charts, these tools provide insights into future price movements. This article delves into the practical applications of Fibonacci arcs in trading, their interplay with market psychology, and best practices for effective use.
Understanding Fibonacci Arcs
The Fibonacci arc indicator is a unique tool in technical analysis derived from the famed Fibonacci sequence. It’s crafted by drawing arcs at the key Fibonacci retracement levels - 38.2%, 50%, and 61.8% - from a high to a low point on a stock chart. Each curve represents potential support or resistance areas, offering insights into the stock’s future movements.
The art of arc reading, meaning interpreting these curves, is crucial for traders. When a stock approaches or intersects with an arc, it reflects a significant reaction level. For instance, if a stock price touches or nears an arc, it could face arc resistance, indicating a potential halt or reversal in its trend.
Applying Fibonacci Arcs in Trading
In the stock market, these arcs serve as a guide for traders seeking to anticipate future price movements. When applied correctly, they can provide critical insights into potential support and resistance levels. Here's a step-by-step look at how you may use them effectively:
- Identifying High and Low Points: Begin by selecting a significant high and low point on the stock's chart. In an uptrend, it’s the most recent swing high to a previous swing low, and vice versa. These are the anchor points.
- Drawing the Arcs: Once the points are selected, draw the arcs at the Fibonacci retracement levels of 38.2%, 50%, and 61.8%. They radiate from the chosen low point to the high point (or vice versa), cutting across the chart.
- Interpretation: Watch how the stock interacts with these lines. When the price approaches an arc, it might encounter resistance or support, signalling a potential change in trend or continuation.
- Timing Entries and Exits: Traders can use the arcs in the stock market as a tool to time their trading decisions. For instance, a bounce could be a signal to enter a trade, whereas the price breaking through might suggest it's time to exit.
Fibonacci Arcs and Market Psychology
The effectiveness of Fibonacci arcs in trading is deeply intertwined with market psychology. They tap into the collective mindset of traders, who often react predictably to certain price levels. The Fibonacci sequence, underlying this tool, is not just a mathematical concept but also a representation of natural patterns and human behaviour.
When a stock nears a curve, traders anticipate a reaction, often leading to a self-fulfilling prophecy. If many traders make an arc stock forecast, they might sell as the price approaches a certain point, causing the anticipated resistance to materialise. Similarly, seeing support at an arc can trigger buying, reinforcing the tool’s power.
This psychological aspect makes Fibonacci arcs more than just technical tools. They are reflections of the collective expectations and actions of market participants, turning abstract mathematical concepts into practical indicators of market sentiment and potential movements.
Best Practices
Incorporating Fibonacci arcs into trading strategies involves nuanced techniques for better accuracy and efficacy. Here are some best practices typically followed:
- Complementary Tools: Traders often pair this tool with other indicators like moving averages or RSI for a more robust analysis.
- Accurate Highs and Lows: It's best to carefully select the significant high and low points, as the effectiveness of the curves largely depends on these choices.
- Context Consideration: Understanding the broader market context is crucial. Traders usually use Fibonacci arcs in conjunction with fundamental factors to validate their analysis.
- Watch for Confluence: Identifying areas where Fibonacci levels converge with other technical signals can provide stronger trade setups.
- Practice Patience: Traders typically avoid making hasty decisions based solely on Fibonacci levels. It's usually better to wait to see additional confirmation from the price action.
Advantages and Limitations of Fibonacci Arcs
Fibonacci arcs are a popular tool in technical analysis, offering distinct advantages and some limitations in analysing stock movements. Understanding these can help traders leverage the tool more effectively.
Advantages
- Intuitive Nature: The Fibonacci sequence is a natural pattern, making the tool intuitive for traders to understand and apply.
- Dynamic Support and Resistance Levels: They provide dynamic levels of support and resistance, unlike static lines, adapting to changing market conditions.
- Versatility: Effective in various market conditions, the arcs can be used in both trending and sideways markets.
Limitations
- Subjectivity in Selection: The effectiveness largely depends on correctly identifying the significant high and low points, which can be subjective.
- Potential False Signals: Like all technical tools, they can generate false signals, especially in highly volatile markets.
- Requires Complementary Analysis: To maximise effectiveness, these curves are usually used alongside other technical indicators, as they are not infallible on their own.
The Bottom Line
Fibonacci arcs are invaluable tools in stock analysis, providing insights into market trends and potential price movements.
This article represents the opinion of the Companies operating under the FXOpen brand only. It is not to be construed as an offer, solicitation, or recommendation with respect to products and services provided by the Companies operating under the FXOpen brand, nor is it to be considered financial advice.