Tesla High Risk of $255Tesla is Stuck under $430 ATH resistance and at high risk of falling back to $255 support.
Tesla is no longer growing and Musk is polarizing and alienating their mostly progressive leaning customer base. This stock simply makes zero sense for a 200 pe ratio.
TL0 trade ideas

TSLA: short as short can...below 200 certainly worth considering a reentry, but currently not sure if it will stop at 200 of 150.

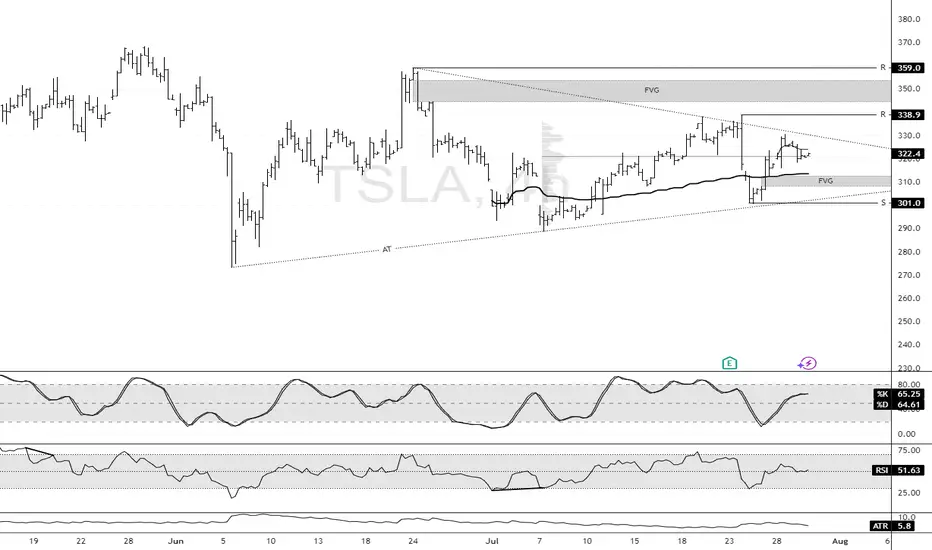
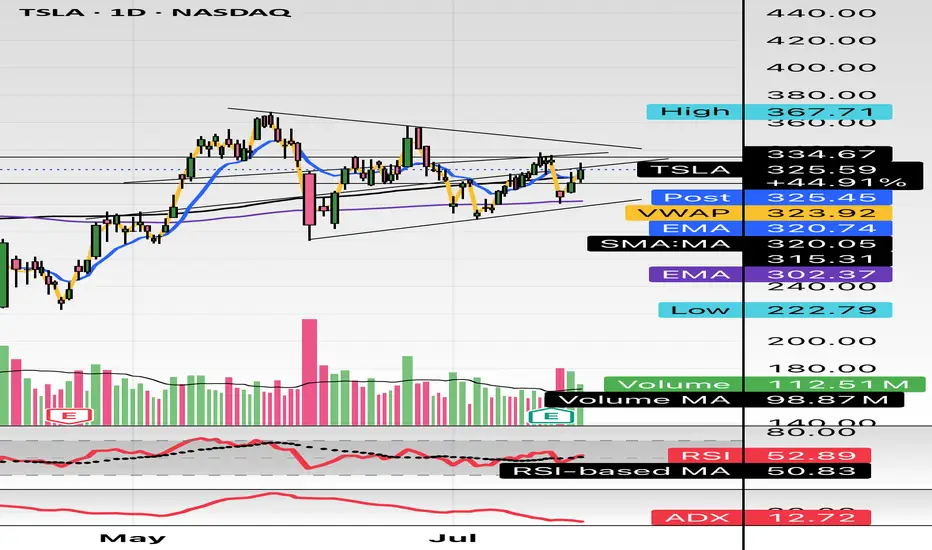
Tesla Builds Toward Fair Value GapFenzoFx—Tesla (#TSLA) bounced from the ascending trendline and closed yesterday's session at the volume point of interest, the $322.3 mark. This level is above the monthly VWAP, meaning bulls are gaining, and bears are losing money.
That said, we expect the uptick in momentum to resume, targeting $338.9, and if this level is breached, the stock will likely aim to fill the Fair Value Gap at $350.0.
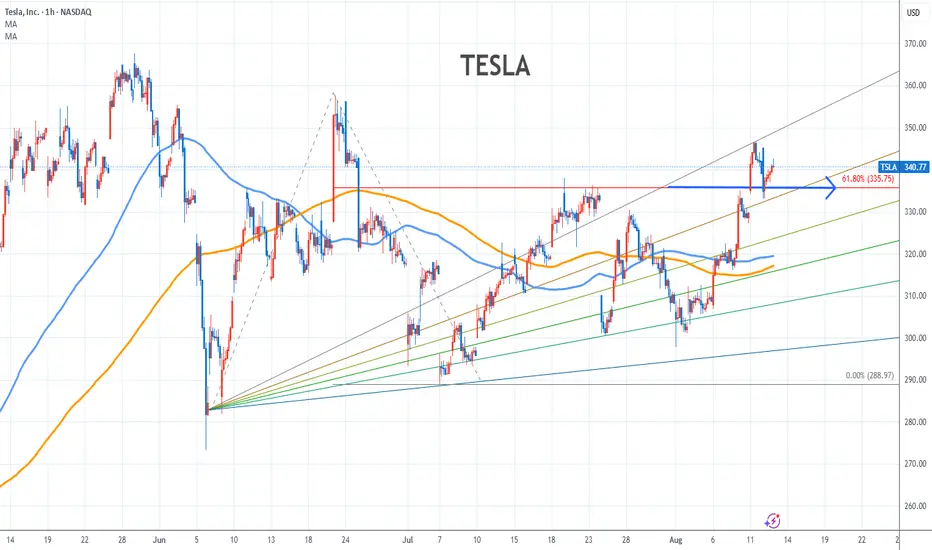
Tesla Stock Chart Fibonacci Analysis 081225Trading Idea
1) Find a FIBO slingshot
2) Check FIBO 61.80% level
3) Entry Point > 335/61.80%
Chart time frame:B
A) 15 min(1W-3M)
B) 1 hr(3M-6M)
C) 4 hr(6M-1year)
D) 1 day(1-3years)
Stock progress:A
A) Keep rising over 61.80% resistance
B) 61.80% resistance
C) 61.80% support
D) Hit the bottom
E) Hit the top
Stocks rise as they rise from support and fall from resistance. Our goal is to find a low support point and enter. It can be referred to as buying at the pullback point. The pullback point can be found with a Fibonacci extension of 61.80%. This is a step to find entry level. 1) Find a triangle (Fibonacci Speed Fan Line) that connects the high (resistance) and low (support) points of the stock in progress, where it is continuously expressed as a Slingshot, 2) and create a Fibonacci extension level for the first rising wave from the start point of slingshot pattern.
When the current price goes over 61.80% level , that can be a good entry point, especially if the SMA 100 and 200 curves are gathered together at 61.80%, it is a very good entry point.
As a great help, tradingview provides these Fibonacci speed fan lines and extension levels with ease. So if you use the Fibonacci fan line, the extension level, and the SMA 100/200 curve well, you can find an entry point for the stock market. At least you have to enter at this low point to avoid trading failure, and if you are skilled at entering this low point, with fibonacci6180 technique, your reading skill to chart will be greatly improved.
If you want to do day trading, please set the time frame to 5 minutes or 15 minutes, and you will see many of the low point of rising stocks.
If you want to prefer long term range trading, you can set the time frame to 1 hr or 1 day.
Is this a higher high on Tesla daily?!I haven't been trading @TSLA for awhile but while I was doing some charting this is what caught my eye.
The lower highs and lower lows trend seems to maybe have come to an end. It broke the trendline, making a higher high & looks like I might turn that last lower high into support now...we will see.😎
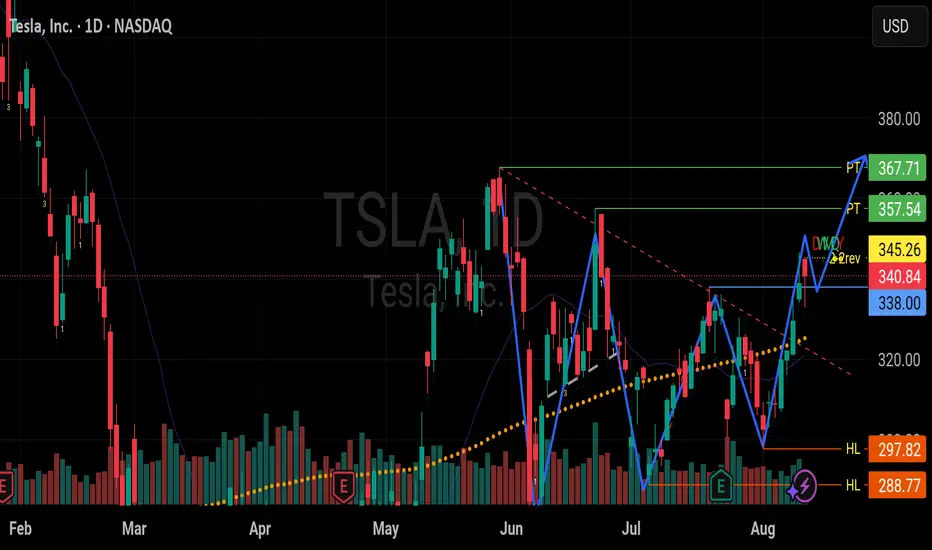
LONG | TSLA NASDAQ:TSLA
TSLA is pressing against a key confluence zone $352–$356 (TP1), aligning with daily and weekly resistance. A confirmed breakout could open the path toward $367 (TP2) and $404 (TP3) in the medium term.
Supports: $326 / $318 – must hold to maintain bullish momentum.
Bias: Bullish if above $326; consolidation or pullback likely if rejected at $356.
A monthly close above $367 would confirm a long-term cup breakout, projecting toward the $500 area over the next cycles.

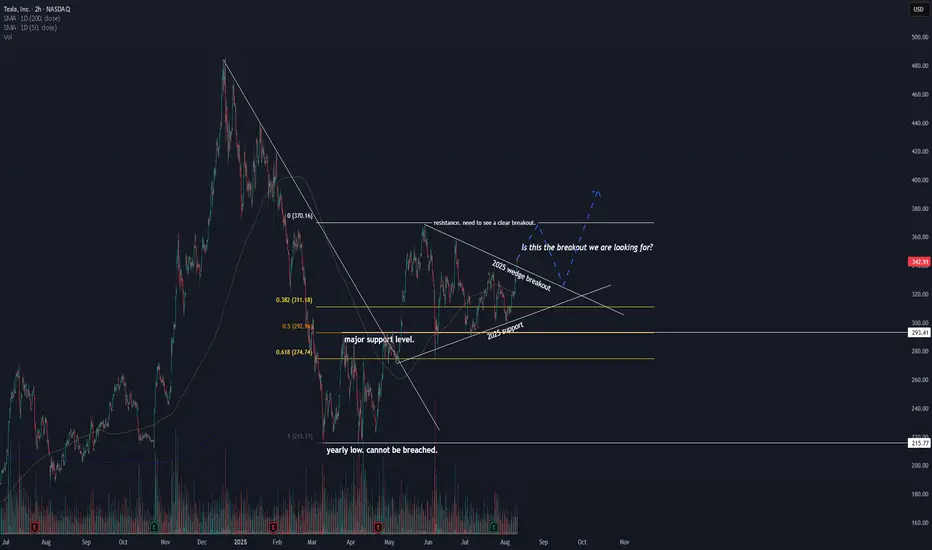
Tesla Short Term Breakout?With Robotaxi, American Party, Elon, Trump... Fugayzi, Fugazi.
What goes with TSLA from a technical standpoint? Let's take a dive.
If we take $215, the yearly low, as a bottom. We can see the $292 level is both the 50% Fib level, and the yearly high before 5/9 , when a clear breakout happened .
This level was tested again during 6/5 (failed, but support at the classic 61.8% support at $275).
And again during 7/7.
We then can draw two inferences: the 2025 support line, and the 2025 wedge breakout line.
Today, we have a clear breakout against that wedge line. Is this the breakout we are looking for? How much will the upside go?
The next key level is $370 . The yearly high this year. We need to see a clear breakout above this level to confirm NASDAQ:TSLA in full blown bull mode.
The blue line indicates a likely scenario for the upcoming months.
Let me know what you think.
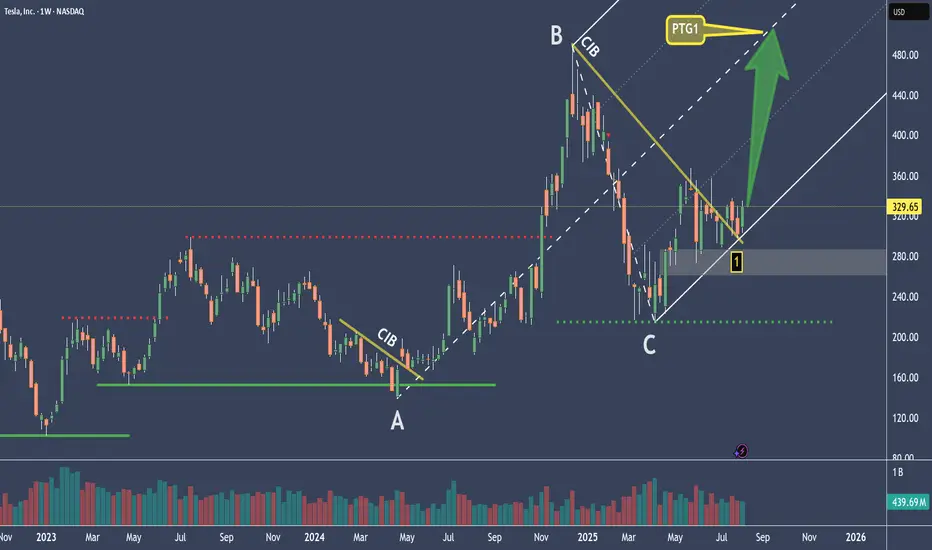
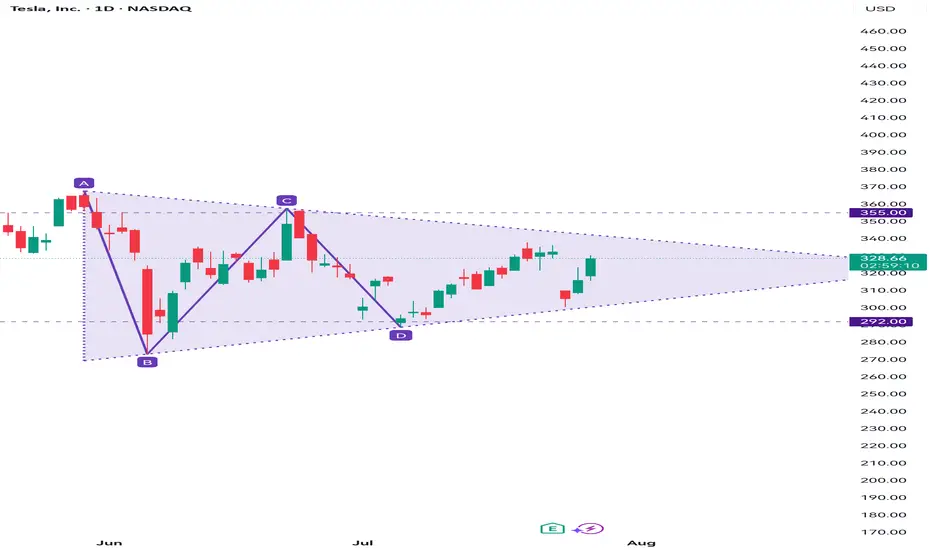
TESLA Is Counting Down The Clock – Moonshot?The red and green lines nicely illustrate what true support and resistance look like.
At the moment, it appears that the market has formed support again (1), but we can’t really confirm this since we don’t have a higher high that has been broken. So we can only assume that the base is at the C point.
We’ve been trading within the fork for several months now, which suggests that we’re once again in a longer-term upward movement.
If that’s the case, then we look for a nice profit target (PTG1) at the CL, because we know there’s over an 80% chance of reaching it.
An open and close outside the fork would be an exit signal, and could indicate a possible reversal to a short position.
I’ll explain further details in the YT video.
TSLA - Larg Cap Gappers State 1 – In-depth Analysis of the Metric Table (TSLA)
Symbol: TSLA – Tesla, Inc.
Exchange: NASDAQ
Index Affiliation: Component of NASDAQ-100 (NDX) and S&P 500; highly liquid, large-cap with global market influence.---
1. Role of the Metric Table
The Metric Table compiles TSLA’s market stats, momentum conditions, volatility profile, and breakout readiness into one quick-reference tool. It enables traders to:
Confirm whether current price action supports momentum trading or requires patience.
Evaluate upside potential and downside protection zones.
Align entries with multi-timeframe trend structure.---
2. Key Data Group Insights
A. Core Stock Data
Auto Cap: Big Cap.
Market Cap: $879.48B – heavyweight market influence.
Volume: 92.1M – very high liquidity.
Public Float: 2.712B shares – large, requiring strong catalysts for outsized moves.
Leverage Multiplier: 0.03 – low natural leverage.
B. Momentum & Price Action
Pump % / Price Δ: +13.36% / +22.99% in recent rallies.
Prev Close / Now: $322.77 / $330.11 – current bullish bias.
Explosive Ratio (10d): 0.12 – moderate short-term move potential.
Natural Leverage (Now): 0.11 – stable for a large cap.
C. Technical Signals
Momentum Signal: Moderate Momentum – trending upward but not yet at breakout acceleration.
Beta Signal: Low Volatility – relatively stable compared to high-beta stocks.
Price Range Signal: Low Volatility – consolidation setting up for next move.
D. Risk Control Metrics
Estimated Stop Loss: $307 (H4) / $305 (1D).
Breakout Ready: L3 – nearing breakout alignment.
Trend Trigger: Levels in sequence for continuation if resistance is cleared.
E. Overall Status
Bull Momentum: YES.
Overall Signal: Excellent (Very Bullish).
Market Phase: Sideways consolidation within broader uptrend.---
State 2 – Risk Management & Trade Structure (TSLA)
Trading Style: Swing breakout strategy, large-cap momentum.
Share Size Scenario: Adjustable based on account size; risk per share determined by SL placement.---
1. Key Entry & Risk Zone
Setup Trigger Zone: $319 – optimal entry on pullback confirmation.
Capital Defense Line: $307 – hard stop for swing positions.
Smart Trailing Guard: $296 – deeper volatility cushion for longer holds.---
2. Breakout Targets
TP1 – Momentum Hold: $342 – first upside checkpoint.
TP2 – Intensity Zone: $353 – major resistance test.
TP3 – Breakout Shift Zone: $365 – aggressive swing target.
Max Exhaustion Limit: $391 – extended run potential on strong momentum.---
3. Trailing Stop Strategy
Entry at $319–$322:
After TP1 → move SL to breakeven.
After TP2 → secure 50% gains, trail remainder under prior 2–3 H1 lows.
If momentum continues into TP3/Max → tighten trailing to 15-min chart for profit lock.---
4. Timeframe Plan
Risk Direction: 4H chart for swing bias.
Entry Confirmation: 10-sec close rule on breakout/pullback candles.
Exit:
Short-term profit lock → 15-min chart.
Extended move → 1H trailing.---
5. Position Management
Size positions so that risk from entry to SL = 1–2% of account equity.
Take partial profits at TP1 & TP2 to secure gains and reduce exposure before major resistance zones.---
Disclaimer
ALGTP Watchlist is for educational purposes only, demonstrating trade setups and risk plans using ALGTP Indicators.
Members must have trading experience and know how to apply ALGTP Indicators.
Without ALGTP tools, traders must self-manage risk.
Not a buy/sell recommendation.

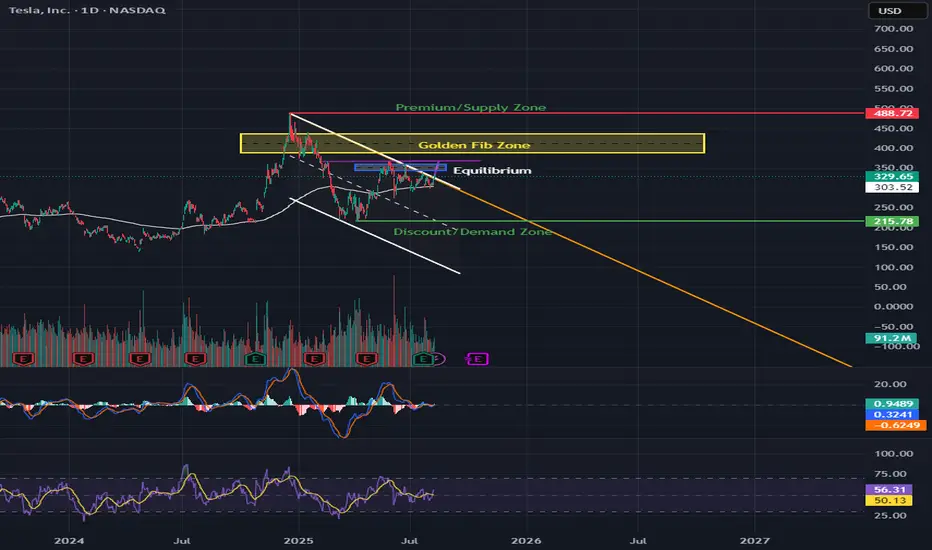
TSLA Golden Zone Test: Cup & Handle Breakout Ahead?📊 Market Breakdown
TSLA is trading at $329.65 and is caught between major zones — the Golden Fib Zone ($365–$385) above and the Equilibrium ($294) below.
Trend: Price recently broke out of a descending trendline but is still inside a bigger channel.
Pattern Watch: There’s a potential cup & handle forming. If confirmed, this could be the fuel that launches us toward the $365–$385 resistance area.
Momentum: MACD is flattening near zero (possible bullish crossover brewing), and RSI at 56 gives us room to push higher before overbought territory.
🛒 CALLS (Bullish Scenario)
Buy Zones:
🎯 Aggressive Entry: Bounce from $320–$325 support
✅ Confirmation Entry: Daily close above $340 with strong volume
Take Profits:
1️⃣ $365 – First target at the start of Golden Fib Zone
2️⃣ $385 – Fib Zone top and key resistance
3️⃣ $488 – Long-term premium/supply zone
Stop-Loss: $315 (just below recent support)
Why This Works: A breakout above $340 also breaks the handle of the cup, unlocking room to run toward $365+.
🛑 PUTS (Bearish Scenario)
Sell Zones:
🚨 Rejects $340 resistance with heavy selling
📉 Breakdown and daily close under $315
Take Profits:
1️⃣ $294 – Equilibrium
2️⃣ $250 – Key psychological level
3️⃣ $215–$220 – Discount/Demand Zone
Stop-Loss: $330 (above rejection point)
Why This Works: A failed breakout with a close under $315 breaks short-term bullish structure, opening the door for a drop back toward $294 equilibrium.
🔍 Technical Highlights
Cup & Handle Potential: Neckline around $340; break = bullish continuation.
EMA 200 ($219.82): Still far below, showing this is more of a swing/mid-term momentum play.
Volume: Recent spikes suggest institutions are active at these levels.
Macro Watch: TSLA moves with tech sentiment; keep an eye on NASDAQ trend.
⏳ Option Expiration Strategy:
1 Week: For quick bounce or rejection plays at $340
2 Weeks: Breakout targeting $365
3 Weeks: Full push toward $385–$488 supply zone
Trading TSLA1:39 am 8/8/25Bullish Entry: 324.00 / 328.00 Bullish Stop 330.00 Bullish Target 330.00
Bearish Entry: 318.00 / 316.00 Bearish Stop 321.50 Bearish Target 312.00.....................Note: Supply zone 335.50/338.00

TSLA pivot points suggesting imminent breakoutTSLA is in a tightening pattern, which can of course break either bullish or bearish. given the overall trend and market conditions, I have a bullish lean on it. After doing some pivot point analysis this evening I have shifted the bull break odds even higher in my mind, and not only that, I believe the bull break may be imminent this week.

TSLA: 321.20Bullish Entries: 322.00 / 323.00 (high activity) Target:
328.00 / 330.00 Stop:
319.00 TSLA needs to close the earning gap at 332.69. Its continuation price of 332.00/336.00 is within the supply zone. Be very careful.

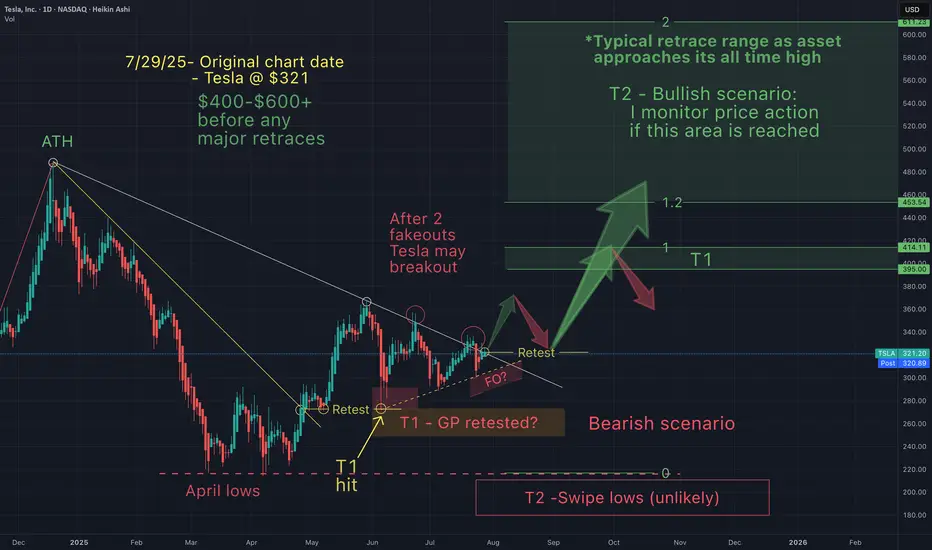
Tesla - A story of an underdogSeveral of the Mag 7 are getting over heated, so I like to look at the ones that haven't caught up.
Since I don't have a crystal ball, I must consider the bearish and bullish scenarios.
As an investor I must pivot accordingly as one of these scenarios gets invalidated.
So on my charts you'll always see both scenarios. Today I'm leaning towards the bull.
Tesla just needs a narrative shift (ie -new invention etc), & price action changes in a heart beat.
Yet, price action really has less to do with the news making Elon a hero, then a villain and then back and forth...but moreso to do with price action patterns that just keep repeating.
So if we don't get a dead cat bounce, I believe Tesla could eventually head towards it's ATH, if this bull market continues.
TSL PatienceTSL Fractal. Another several months of accumulation until December 2027 Chop then Parabolic. Chop Chop Chop. Dollar Raising Risk Off. Bitcoin Topping. Dollar Bottoming.

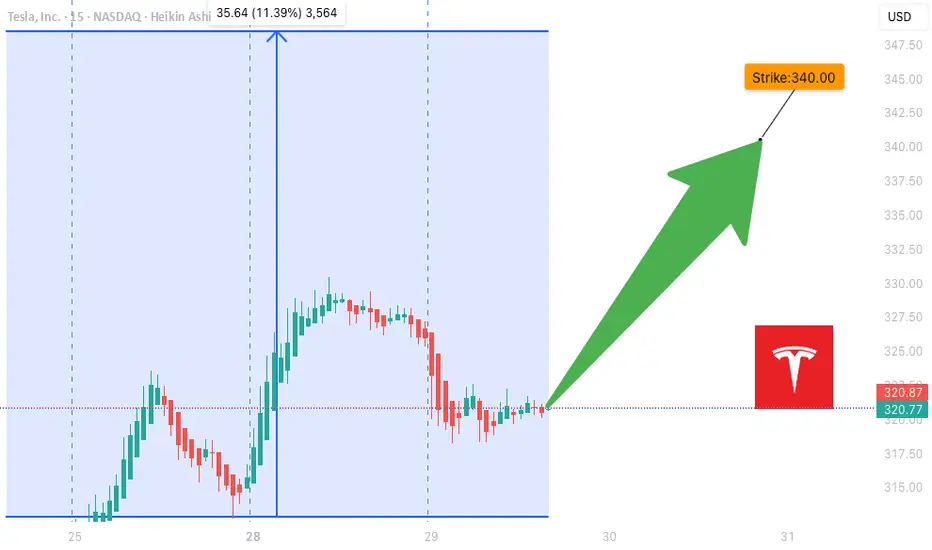
SLA Moderate Bullish Setup – Weekly Play for 08/01 Expiry
## ⚡ TSLA Moderate Bullish Setup – Weekly Play for 08/01 Expiry
🎯 *"Volume confirms it. RSI supports it. Time to strike—or stand by."*
---
### 🔍 Market Intelligence Snapshot:
📊 **Consensus**: Moderately Bullish
📈 **Weekly RSI**: Rising
📉 **Daily RSI**: Still Neutral (momentum building)
📉 **VIX**: Low → Great environment for call buying
📦 **Volume**: Strong institutional activity across models
---
### ✅ Recommended Trade Setup:
**TSLA \$340 CALL (Exp: Aug 1)**
💰 *Entry*: \~\$0.88
📈 *Target*: \$1.38
🛑 *Stop*: \$0.35
📆 *DTE*: 3 Days
🎯 *Entry*: Market Open
⚖️ *Confidence*: 65%
---
### 🔧 Model Blended Strategy Notes:
* Meta & Anthropic: Suggest ATM/ITM (\$327.50–\$330) → safer, higher cost
* Google & xAI: Prefer \$340–\$342.50 for a better risk/reward
* DeepSeek: Targets \$320 but with heavier premium
🧠 *Takeaway*: \$340 offers a balanced shot — affordable, but still responsive to upside flow.
---
### ⚠️ Risk Notes:
* ⏳ Time Decay → Quick exits = better outcomes
* 📰 External news or earnings reactions = watch for sudden volatility
* 🎯 Position size = keep light due to only 3 DTE
---
### 📊 TRADE SNAPSHOT (JSON):
```json
{
"instrument": "TSLA",
"direction": "call",
"strike": 340.0,
"expiry": "2025-08-01",
"confidence": 0.65,
"profit_target": 1.38,
"stop_loss": 0.35,
"size": 1,
"entry_price": 0.88,
"entry_timing": "open",
"signal_publish_time": "2025-07-29 10:16:14 UTC-04:00"
}
```
---
### 🧠 Quick Captions for Social:
* “TSLA bulls waking up? \$340C looks lit for the week 📈🔥”
* “Call volume surging. RSI rising. Low VIX. This \ NASDAQ:TSLA 340C might run 💥”
* “Risk-managed breakout shot — in and out fast 🎯”
$TSLA either one big flag or massive short setting upHello,
Just some browsing, NASDAQ:TSLA hasn’t had any major moves prior to early May - June IMO. This is on my watch for a short swing setup. This is bull flagging but I see a short here. I’m conflicted. I do see the higher low but we are in a pitchfork and this has been consolidating in this $290-$340 area for about a month and half. There’s also a lower high. Just posting for some free dialogue and open ideas. Talk to me. Let me know what you see and think. We aren’t too far from 200EMA and 200SMA. It’s just curling above the 50 as well. Maybe we consolidate for another week or two? A massive move is brewing here I think. I’m talking $100 in a week up or down soon.
WSL
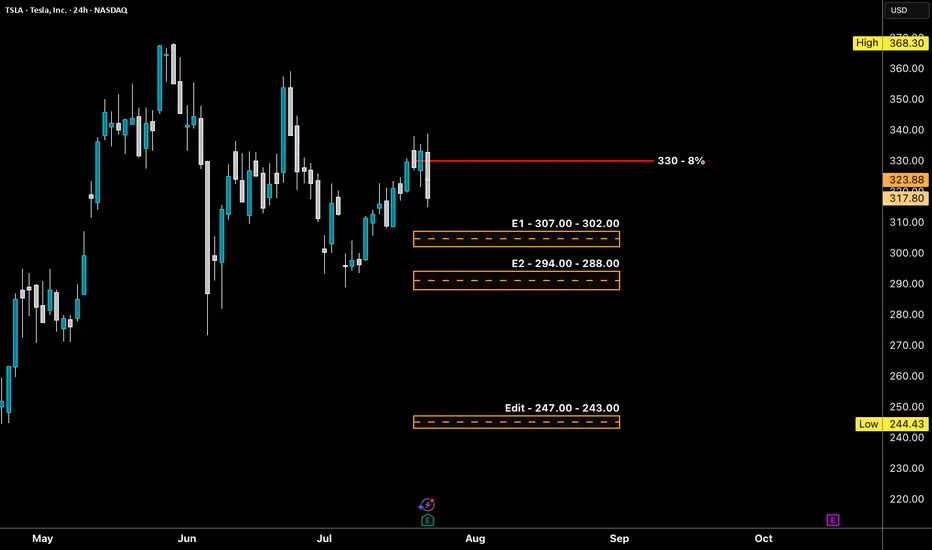
TSLA - LONG Swing Entry Plan NASDAQ:META - LONG Swing Entry Plan
Entry Zone 1: $307.00 – $302.00
→ Open initial position targeting +8% from entry level.
Entry Zone 2: $294.00 – $288.00
→ If price dips further, average down with a second equal-sized entry.
→ New target becomes +8% from the average of Entry 1 and Entry 2.
Edit Zone (Aggressive Demand): $247.00 – $243.00
→ If reached, enter with double the initial size to lower the overall cost basis.
→ Profit target remains +8% from the new average across all three entries.
Risk Management:
Stop Loss:
Risk is capped at 12% below the average entry price (calculated across all executed positions including the Edit Zone).
Position Sizing Approach:
Entry 1: 1x
Entry 2: 1x
Edit Zone: 2x
→ Total exposure: 4x
→ Weighted average determines final TP and SL calculations.
______________________________________
Legal Disclaimer
The information provided in this content is intended for educational and informational purposes only and does not constitute financial, investment, or legal advice or recommendations of any kind. The provider of this content assumes no legal or financial responsibility for any investment decisions made based on this information. Users are strongly advised to conduct their own due diligence and consult with licensed financial advisors before making any financial or investment decisions.
Sharia Compliance Disclaimer: The provider makes no guarantees that the stocks or financial instruments mentioned herein comply with Islamic (Sharia) principles. It is the user’s responsibility to verify Sharia compliance, and consultation with a qualified Sharia advisor is strongly recommended before making any investment decisions
TSLA WEEKLY OPTIONS SETUP
### 🚗 TSLA WEEKLY OPTIONS SETUP (2025-07-28)
**Big Call Flow. Low VIX. Can Bulls Hold \$325?**
---
📊 **Momentum Overview:**
* **Daily RSI:** 48.2 🔻 → *Neutral-to-Weak*
* **Weekly RSI:** 57.1 🔻 → *Still bullish zone, but falling*
⚠️ **Interpretation:** Momentum is softening, trend in question.
📉 **Volume Context:**
* **Volume Ratio:** 1.3x ⬆️ (vs. last week)
* **Price Change:** -0.77% despite that volume
🔍 *Distribution Alert:* Institutions may be selling into strength.
📈 **Options Flow:**
* **Call/Put Ratio:** **1.70** = 🚨 *Bullish flow confirmed*
* **Volatility (VIX):** 15.16 🟢 Favorable for directional plays
✅ Strong setup for options traders riding short-term momentum
---
### 🧠 **Weekly Sentiment Scorecard:**
* ✅ **Bullish Signals (2):** Options Flow, Volatility
* ⚠️ **Neutral Signals (2):** Daily & Weekly RSI
* ❌ **Bearish Signal (1):** Volume pattern = distribution risk
**Overall Bias:** 🟢 *Moderate Bullish*
---
### 🔥 **TRADE SETUP IDEA:**
🎯 **Strategy:** Long Call Option
* 📌 **Instrument:** TSLA
* 💵 **Strike:** \$355C
* 📅 **Expiry:** Aug 1, 2025
* 💸 **Entry:** \~\$0.75
* 🎯 **Profit Target:** \$1.50
* 🛑 **Stop Loss:** \$0.45
* 🔒 **Key Support to Watch:** \$327.50 — lose that = exit fast
📈 **Confidence Level:** 65%
⚠️ **Gamma Risk:** High → trade small, manage tight.
---
### 📦 TRADE\_DETAILS (JSON Format for Algo/Backtest):
```json
{
"instrument": "TSLA",
"direction": "call",
"strike": 355.0,
"expiry": "2025-08-01",
"confidence": 0.65,
"profit_target": 1.50,
"stop_loss": 0.45,
"size": 1,
"entry_price": 0.75,
"entry_timing": "open",
"signal_publish_time": "2025-08-01 09:30:00 UTC-04:00"
}
```
---
### 🧭 **Quick Notes for Traders:**
* ✅ Bulls have short-term edge — but **momentum is fading**
* ⚠️ If TSLA breaks below **\$325**, exit fast.
* 🔍 Watch for fakeouts: options flow is bullish, but volume says “not so fast.”
---
📊 TSLA \$355C → Risk \$0.75 to potentially double 📈
💬 Will this hold, or is it a bull trap before a dump? 👀
Comment below ⬇️ and follow for Monday updates!
---
**#TSLA #OptionsFlow #WeeklyTrade #TradingSetup #GammaRisk #AITrading #TeslaStock #UnusualOptionsActivity #SmartMoneyMoves**

$TSLA: Breakout Wave Dimensions🏛️ Research Notes
Apart from known compression patterns for Tesla, there is another squeeze happening on smaller scale:
That area will be processed to derive the chart-based levels and see how market reacts to them.
Triangle
Breakout Expansion

Tesla Stock in Bearish Trend - Further Downside ExpectedTesla Stock in Bearish Trend - Further Downside Expected
Tesla's (TSLA) stock price continues to display a clear bearish trend structure, characterized by the formation of consistent lower lows and lower highs on the price chart. This technical pattern suggests sustained selling pressure and indicates the downtrend will likely persist in upcoming trading sessions.
Key Technical Observations:
- Established Downtrend: The consecutive lower highs and lows confirm the bearish price structure remains intact
- Weak Momentum: Each rally attempt has failed to gain traction, meeting selling pressure at progressively lower levels
- Critical Price Levels: The stock has established well-defined resistance and support zones for traders to monitor
Price Projections:
- Downside Target at $272: The bearish momentum could drive TSLA toward the $272 support level, representing a potential 15% decline from current levels
- Key Resistance at $370: Any recovery attempts will likely face strong selling pressure near the $370 level, which now serves as a major resistance barrier
Market Implications:
1. Bearish Continuation Expected: The prevailing trend structure favors further downside unless a significant reversal pattern emerges
2. Breakdown Risk: A decisive move below current support levels could accelerate selling momentum toward $272
3. Short-Term Rally Potential: While the overall trend remains down, temporary rebounds toward $370 may present selling opportunities
Trading Considerations:
- Short Positions: Consider maintaining bearish exposure while price remains below the $370 resistance level
- Stop Loss: A sustained break above $370 would invalidate the immediate bearish outlook
- Profit Targets: $272 serves as the primary downside objective, with potential support levels to watch along the way
Risk Factors to Monitor:
- Market sentiment shifts in the EV sector
- Changes in Tesla's production/delivery outlook
- Broader market conditions affecting tech/growth stocks
The technical setup suggests Tesla shares remain vulnerable to further declines, with $272 emerging as the next significant downside target. Traders should watch for either confirmation of the bearish continuation or potential reversal signals near key support levels. As always, proper risk management remains essential when trading in trending markets.

A Strategic Long Opportunity Amid VolatilityCurrent Price: $316.06
Direction: LONG
Targets:
- T1 = $324.00
- T2 = $328.50
Stop Levels:
- S1 = $312.50
- S2 = $308.00
**Wisdom of Professional Traders:**
This analysis synthesizes insights from thousands of professional traders and market experts, leveraging collective intelligence to identify high-probability trade setups. The wisdom of crowds principle suggests that aggregated market perspectives from experienced professionals often outperform individual forecasts, reducing cognitive biases and highlighting consensus opportunities in Tesla.
**Key Insights:**
Tesla’s stock presents both short-term risks and long-term upside opportunities. Despite recent earnings misses and margin compression, its pivot into AI and robotics offers significant growth opportunities. Upside resistance zones near $325-$330 create favorable price targets, while support levels at $307-$310 suggest strong buying interest. This environment could favor a long trading strategy, provided disciplined risk management is maintained.
**Recent Performance:**
Tesla recently experienced notable sell-offs following disappointing earnings, attributed to compressed margins and weaker EV demand. However, the stock rebounded 3.5% from last week’s lows, signaling resilience amid uncertainty. Year-to-date, Tesla remains one of the top-performing stocks with a 54% price increase, reflecting strong underlying investor confidence in its long-term story.
**Expert Analysis:**
Market experts are divided on Tesla’s trajectory. Near-term fundamentals appear challenging with declining revenue (-12% YoY) and price cuts impacting profitability. However, bullish projections from analysts such as Kathy Wood highlight Tesla’s potential for disruptive innovation in AI and robotics. Its ambitious initiatives like robo-taxi deployment add speculative appeal but also introduce scaling and regulatory risks.
**News Impact:**
Tesla’s upcoming robo-taxi launch in San Francisco is poised to impact market sentiment significantly. While safety drivers will be required during the initial rollout, scalability and regulatory challenges could limit the project’s immediate impact. Meanwhile, recent disappointing earnings results may weigh on sentiment in the short term while providing an opportunity for potential retrishments off support levels.
**Trading Recommendation:**
Given the current setup, Tesla appears poised for long-term growth, with upside resistance levels suggesting a viable rally opportunity. Investors should consider taking a bullish position while maintaining stops near key support zones to mitigate downside risks. This balanced approach aligns well with Tesla’s speculative appeal and broader investor sentiment.
