Syscoin on Airwhat is SYS? The powerful multi-purpose platform that puts your business on the block-chain
SYSBTC trade ideas


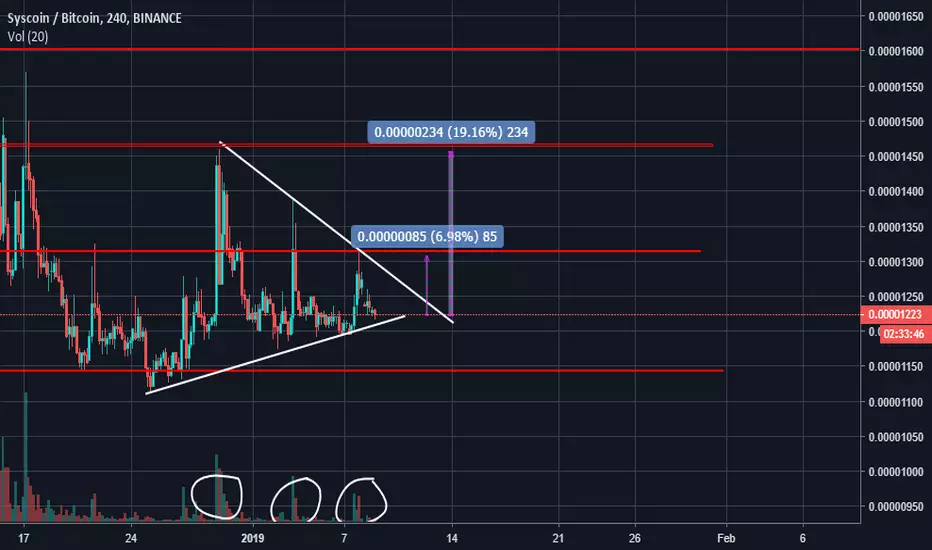
SYS/BTC- Bull Flag PatternBull flag is forming in SYS. If price closes above the flag, price can reach the above given levels.
The set up is quite good, unless BTC spoils the party.

SYS / BTCSYS / BTC
Exchange : #BINANCE
Buy : 1222
Target 1 : 1300
Target 2 : 1380
Target 3 : 1450
Stop loss : 1170

SYSBTC updated chartIDEAS ONLY HERE! Starting from here on, I'm aiming for cleaner, more simple charts. With stronger stops and sell zones. See you in the year 2019. Peace, the Dill. Win Donations would be a nice gesture and good karma.

SYSBTC completed the bearish BATSYSBTC has almost completed the BAT pattern insha Allah, now it is in sell zone.
Regards,
Atif Akbar


SysNot sure if we missed the boat on this one? I f we get the golden cross, things might get interesting.
No trading advice here. Ideas!

SYSBTC in a search of a good entry pointAt the 3-hours timeframe we can see a formed triangle and a subsequent upward movement in a pattern of a Bullish Flag. Nevertheless fluctuations are too low to make a good profit and the market is too risky right now.
Currently indicators are bearish nevertheless Impulsive growth can bring the price to the top of the triangle and form a Flag in a Ichimoku clouds zone. However volume of trade is too low and there are no sufficient fundamentals to break out of the triangle earlier.
We recommend to carefully watch this coin, as in the short term it has opportunities to change the trend. Signals will be provided once the best entry moment will be found

SYSBTC BUY OPPORTUNITYThere are two ways to trade this coin either to place a buy from the given BUY zone or wait for the breakout of the Ascending triangle to buy the pull back.
Pattern detected are:
CUP Formation
Ascending Triangle
Bearish Channel
Possible Entry and exit targets are clearly stated on the chart.
BLUE: POSSIBLE ENTRY ZONE
RED: Possible Support LEVEL
GREEN: SELL TARGETS
Join our discussion room for more about our trading ideas.
Please share your thougths about it and support my post with your LIKES.
Thanks
Note:
It will be good to always understand risk involve in trading. Always trade with stop Loss in place.
Set up an entry/exit strategy for every trade, with good risk/reward ratio.

sys best too buy now 1450_1500sat best zonesys best too buy now 1450_1500sat best zone
sell t1=1700
sell t2=1800
sell t3=2150
sell t4=(long=3000)


#SYS Good Entry PointBuy Between - 0.00001450/1350
Target in charts
Stop After Close 1D Candle Under - 0.00001350


SYS Trading AdviceBuy Price: Yellow Line
TP: Green Lines
Invest Suggestion: 5-10 Percent
Profit Expectations: 5, 10 or >20 Percent
Just hold and watch. All targets will be reached within 24 to 72 hours as my prediction. But it's recommended to hold it for 6-7 days if any target not reached. Sell when you got some profit. I am sure, you will be get nice profit. Good Luck!
Looks Good? Leave a like, share and tell me in comments if my trading advices are working for you or I am just wasting my time and effort.
Show your love.
Stellar Lumens: GAGSVFQMNGMDDQBCK4Z6VODA72KNV5NSFJGKIJP4LUVB5ASD6CZI2FYM
Thanks for visiting.

SYS - LONG - TENKAN CROSSSysCoin looking good on the 1d chart, with a 1d Tenkan cross and the price currently resting on top of the Tenkan, this graph just looks like it could go crazy at any moment now. Sys has gone through a deep fall since July with no signs of recovery until now.
Entries: below 0.00001500
Target 1: 0.00001619
Target 2: 0.00001753
Target 3: 0.00001990
Stop Loss: 0.00001370
Disclaimer
CryptoCue is not providing individually tailored investment advice and is not taking subscribers personal circumstances into consideration when discussing investments. Investment involves a high degree of risk and should be considered only by persons who can afford to sustain a loss of their entire position. Investors should consult their registered financial adviser before investing.
CryptoCue is not registered to provide investment advice and is simply providing an opinion, giving a particular experience. Information contained here is not an offer or solicitation to buy, hold, or sell any security.
CryptoCue is not a broker-dealer or financial adviser and is not affiliated with an investment advisory firm and does not engage in activities that would require such registration.
CryptoCue and/or any others affiliated with CryptoCue, are not responsible for any gains or losses that result from the opinions expressed herein.
CryptoCue makes no representation as to the completeness, accuracy, or timeliness of the material provided and all materials are subject to change without notice. Opinions discussed herein have not been reviewed by the securities and exchange commission or any state securities regulatory authority.

Daily Bullish Signal #SYS #SYSBTC (24-09)#SYS (SYS/BTC)
Buy : 1300-1350
Flash Sell : 1400
Short Sell : 1450
Long Sell : 1550-1650-1750-1850
Stop : 1250
Follow me for more signals daily
Inbox me if you need more services

SYSBuy Price: Yellow Line
TP: Green Lines
Invest Suggestion: 5-10 Percent
Profit Expectations: 5, 10 or >20 Percent
Just hold and watch. All targets will be reached within 1-3 days. But sell after 6-7 days if any target not reached. Good Luck!
Thanks for visiting.

SYS targets for 7-22% profitTogether with all alts SYS has started its own uptrend. Now we are standing on 1700 support but looks a bit overbought which may result in falling back to 1630 (mostly depending on BTC). If not next targets will be 1820, 1970 and 2080 (7%, 15% and 22% respectively). Each target is potential support. Watch it closely as once it breaks the coin will fall back to previous resistance level.
Check out the daily chart for SR zones.
Good luck with your trades - trade on your own risk. I'm just practicing TA.

Daily Bullish Signals #SYS #SYSBTC (16-09)#SYS (SYS/BTC)
Buy : 1250
Flash Sell : 1300
Short Sell : 1350
Long Sell : 1400-1450-1500-1550
Stop : 1200
Follow me for more signals daily
PM me if you need help or learn to trade

The only altcoin worth 96 Bitcoins :) Yes, the controversial SYS is back in uptrend. This is the same coin which spike up to 96 BTC per coin (of course that was some shady price action because of a system exploit).
Then it tanked back to 0.00002 immediately (which is to be expected) But the fact is that many bought that coin on higher prices and still holding, gives it chance to pickup pace again.
Hopefully Elliott waves will be on our side. And momentum indicator (4 hr) is also showing positive momentum shift after a long time.
There is a huge possibility of getting up to 0.000024 or even up to 0.00003. which is a whooping 10% + gain
Its a good investment for next few days.
My play would be to buy and hold for 3 to 5 % gains.
Place stop loss at 0.00002 or if you are more worried watch for a breakout below 55EMA.
Don't panic in spikes because this is a small coin and a victim of pump and dump.
Keep an eye on BTC , any altcoin analysis is done assuming no sudden extreme BTC movements.
Happy Hunting.
Note:- This is not a financial advise.
