SYSBTC trade ideas

SYSwhat i think is the resistance = orange lines
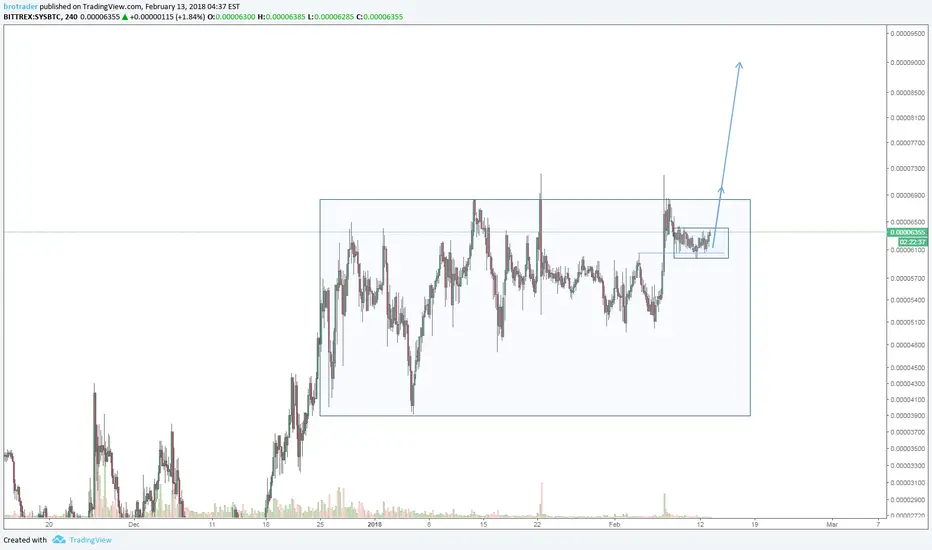
what i think is the support = blue lines
black line = trend line .


SYS CUP AND HANDLE
SYS / BTC :
BUY : 0.000063/65 BUY ZONE
SEL :
TARGET 1 : 0.000068
TARGET 2 : 0.0000692
TARGET 3 : 0.000072
STOP LOS : 0.0000598
BITTREX

SYSCOIN midterm opportunityBullish pennant, good fundamental 28 february - mainnet release, 31 march - hard fork.
buy - 0.00005974 - 0.00006143
TP1 - 0.00008210
TP2 - 0.00008865
TP3 - 0.00009832
stop loss - 0.00004927

$SYS 4H Restesting Strong Resistance line$SYS 4H Restesting Strong Resistance line, might reject it for now and break in the coming days due to Binance listing announcement.


SYSBTC about to break resistanceSYSBTC in my opinion became a buy on December 18th as it passed through EMA30 and all the way to EMA240 on the 1 Day chart. I got this information from another location but based on my own analysis, I am providing these modified targets.
SYS / BTC
BUY BETWEEN: .00006000 - .00006200
SELL TARGET 1: .00007100
SELL TARGET 2: .00008400
SELL TARGET 3: .00010500
STOP LOSS: .00005800


$SYSBTC long idea #cryptocurrency$SYSBTC long idea. Buy under 6150 sats. Accumulation zone. Mainnet release this month. Hardfork in 1Q18.

SYS ANALYSIS FEBRUARY 10 , 2018The price moves in a bullish channel, facing a strong resistance zone that has been tested more than once between 0.00006597 BTC and 0.00007200 BTC
If the resistance zone is breached we expect the price to result in 0.00008120 BTC and then 0.00009170 BTC
In the case of a breach of the ascending channel, the prices will move down to the support area of 0.00005237 BTC
Then 0.00004000 BTC


SYS/BTCSYS/BTC
1 entry = 0.00006038
2 entry = 0.00007255
stop loss = 0.00003727
1 take profit = 0.00009833
2 take profit = 0.000013093

sys to new targets crossing the red line and stayed for while , we will see a new targets
&
Inverse Head and Shoulders Pattern confirmed

Sys staying above the trend line for a couple of days will take us to new targets
0.000058_0.000059 buy zone , it's above the trend line and above 0.61 in fib


SYS / BTCSYS at the bottom of the channel, if it holds it can make a nice move up to 8000-9000 level.
BITTREX:SYSBTC


Buy #SYS around 5800, Sell 6250, 6850, 7500+ Short TermBuy #SYS around 5800, Sell 6250, 6850, 7500+ Short Term

SysCoin(SYS) - GOLDEN CROSS (Bittrex/Poloniex)Fundamentals :
Sys will be releasing Blockmarket web & Desktop by 31.jan
Mainnet release by 28.Feb.
________________
Chart :
Formation : Both daily and the 4h chart are in a ascending triangle, the daily chart is also in a bullish symmetrical triangle.
Indicators :
First of all we will start with the Golden cross , on the daily chart (on bigger scale) Sys's 50 MA has crossed both the 100 and 200 MA line. so we're going to be on a bullish trend for a longer period of time.
MACD - daily seems like its preparing to curve up, 4h chart and under has the MACD already crossed and it's going up. seems like it's taking a sharp turn upwards too!
RSI - both on daily and 4h seem like they're moving strongly upwards.
________________
Buy under 0.00006460 - second buy-in zone will be after we break the triangle and close above it.
TARGETS :
7212
7965
8560
9042
9444
10400
