SYSBTC trade ideas

Syscoin Gains Momentum | Next/High Targets Mapped (144%/215%)Syscoin (SYSBTC) is now gaining bullish momentum so we can direct our focus to the next targets.
The 0.786 Fib. extension was hit today, so on the next move, we aim at the black dashed line (0.00000453).
If this level can be conquered, we look at 0.00000610 followed by 0.00000863 for up to 144% in potential profits... Much more is possible mid-term for Syscoin (SYSBTC).
If you want to look at the indicators and chart signals, check my previous analysis below | Jan. 1, 2020:
Thanks a lot for reading.
Hitting LIKE helps me do more work.
Namaste.


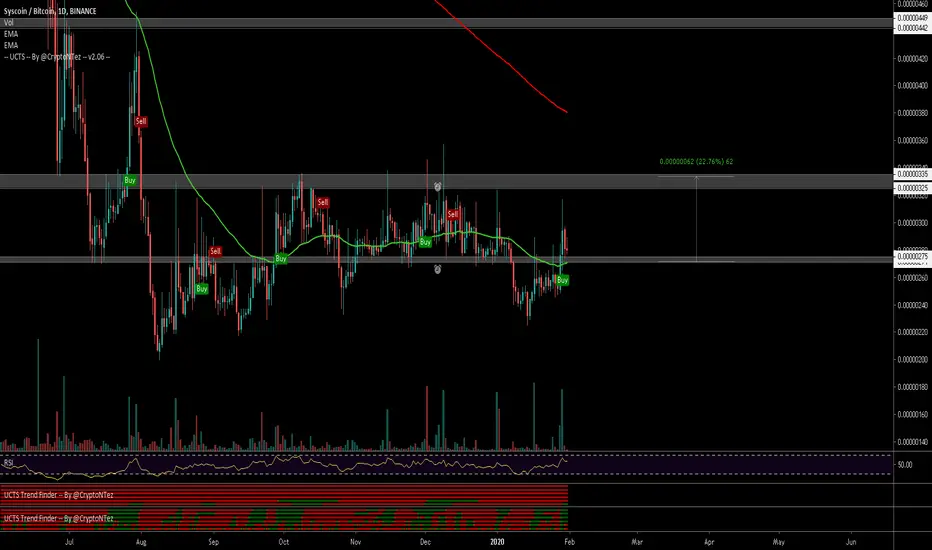
SYSBTCLooking at SYS on the daily
If you feel like you've missed out on the SYS this could be your second chance.
Looking to buy in the green zone, we hand a gap around 300 sats which also lines up with the .786 fib and the POC on VPVR
"Note" Histogram is still printing its last bar. What does this mean? If it prints lower the will more than likely continue down towards the 786 but if we print above we could see a continuation higher from here as the bulls are still in control of volume.
You could set some stink bids like I will be doing just in case someone decides to fat finger their puts.
If you like what I do, drop a comment, tell me what you think and don't forget to like and subscribing. Thanks :)

SYSBTC - bUll - dip - bounc- swingclose above 439 with Vol-> Moon trend
support at 311, 344 & 420 . swings back & fro.
pull back retest fib 38 or 50 to continue bul trend.
fib 62 is also 200 ema dip below uptend ltf nullifier.
344 is solid S.
break lowest S -> Submarine trend
All total lot of interesting things on card .


SYS ANALYSIS (WAIT FOR FURTHER DROP)SYS ANALYSIS:
SYS peaked after reaching a high of 590+ sats. Since then, SYS has been on a strong retrace. I expect a possible further decline into the yellow box, which should hold as the next support level. The main entry zone that I am looking for is inside the zone of 280-320 sats. After this point, I do expect another attempt at the daily resistance giving the outlook profit targets of T1 at 390 and T2 at 424 sats. RSI has plenty of room to come down on the daily and volume is still declining. I dont see a reason to jump into a long yet, wait for further confirmation or a drop into the buy zone!
Possible Entires: 280-320 sats


Syscoin Moves Next | The Altcoins Market Heats Up!Syscoin (SYSBTC) has been on my list to share a trade for a few days but my laziness didn't allow me to publish.
Take a look at the chart above, SYSBTC just produced a strong breakout and shows great potential for additional growth.
In my previous chart, I have this clearly mapped out, see it here:
Thanks a lot for your continued support.
Prosperous & Healthy 2020.
Namaste.


$SYS, Crossed and retesting ~275sats level (matching ema50)...$SYS
Crossed and retesting ~275sats level (matching ema50) on the 1D
Volume tends to spike on this asset from nothing, so taking an entry at potential support level could be a good idea w/ target at ~325sats..
UCTS Buy signal on the 1D and lower TFs..
#SYS
SysCoin Price near Key Resistanceprice is near key Resistance if close above the resistance than coin can jump 20% - 30% in short period of time
1) Volume breakout
2) price above 21 ema need to hold
3) facing Resistance with high volume
daily close above 278 - 280 is very good for next departure till than we must wait and enjoy the breakout will buy Retest ..

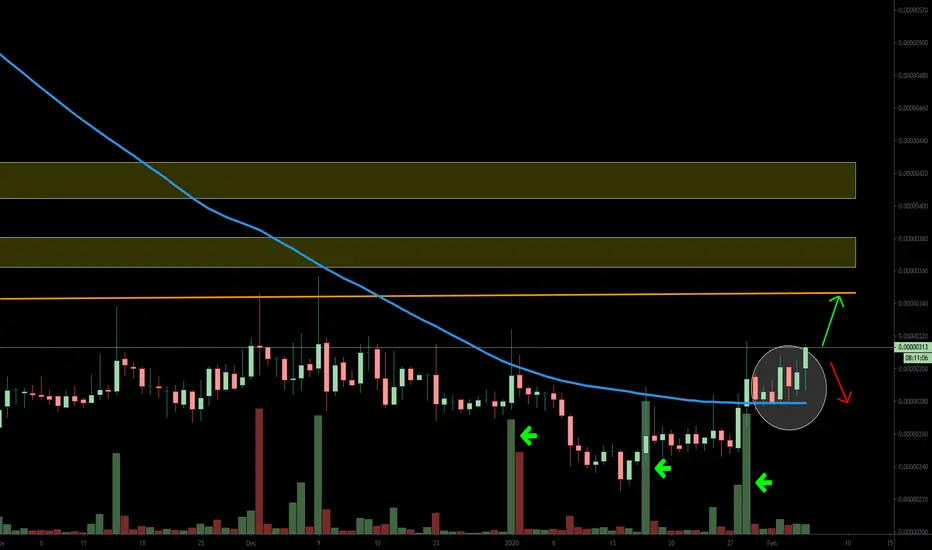
Syscoin Mapped | Support, Targets & Different PathsHere we have the chart for Syscoin (SYSBTC) fully mapped, please allow me a minute to share some of the details.
We have multiple channels, support, and resistance levels marked on this chart.
The light yellow area is where sideways consolidation can happen, prices going flat (blue arrow).
If 0.00000307 is broken, we can expect the bullish scenario to start to play out (green arrows).
If 0.00000268 is broken, we can expect the bearish scenario to start to take form (red arrows). Note, a bounce can always happen when the bearish scenario is activated because we are looking at a bullish chart in general.
The trend in general is bullish as we are seeing higher highs and higher lows.
The altcoins market is also growing and conquering resistance after resistance in a try to move higher.
Syscoin has huge potential long-term... Keep an eye on the chart.
Thanks a lot for reading.
Namaste.


LONG - SYS - Trading OpportunityThis has been consolidating for a few days right below the cloud after a TK cross, expectations are high on this trade but we are going to keep the conservative mindset regarding the targets.
Entry: 0.00000299
SL: 0.00000283
TP 1: 0.00000318
TP 2: 0.00000343
TP 3: 0.00000422
CryptoCue is not providing investment advice and is not taking subscribers’ personal circumstances into consideration when discussing investments. Investment involves a high degree of risk and should be considered only by persons who can afford to sustain a loss of their entire position.
CryptoCue is not registered, licensed or authorized to provide investment advice and is simply providing an opinion, which is given without any liability or reliance 1.71% whatsoever. The information contained here is not an offer or solicitation or recommendation or advice to buy, hold, or sell any security. CryptoCue makes no representation as to the completeness, accuracy or timeliness of the material provided and all information and opinions provided by CryptoCue are subject to change without notice and provided on a non-reliance basis and without acceptance of any liability or responsibility whatsoever or howsoever arising. You hereby irrevocably and unconditionally waive, release and discharge: (a) any and all accrued rights and/or benefits you may have against CryptoCue in respect of any opinion expressed or information conveyed by CryptoCue at any time; (b) any and all Claims you may have against CryptoCue arising out of any opinion expressed or information conveyed by CryptoCue at any time; (c) CryptoCue from all and any claims (whether actual or contingent and whether as an employee, office holder or in any other capacity whatsoever) including, without limitation, Claims you may have against CryptoCue arising out of any opinion expressed or information conveyed by CryptoCue at any time. ("Claims" shall include any action, proceeding, claim, demand, judgment or judgment sum of whatsoever nature or howsoever arising.) You hereby agree to indemnify and hold harmless CryptoCue in respect of any and all Losses paid, discharged, sustained or incurred by CryptoCue in the event of bringing any Claim against CryptoCue. (“Losses” shall include any and all liabilities, costs, expenses, damages, fines, impositions or losses (including but not limited to any direct, indirect or consequential losses, loss of profit, loss of earnings , loss of reputation and all interest, penalties and legal costs (calculated on a full indemnity basis) and all other reasonable professional costs and expenses and any associated value-added tax) of whatsoever nature and/or judgement sums (including interest thereon).)

ema200 test coming soonlike the schedule
are under 200 EMA
this means we are going to test it on a 4-hour watchmaker's setup for growth.
But in order to see growth, it is necessary to break through resistance at the beginning.
Breakdown will be strong and immediately to the goal
You can put a purchase order pending
