Syscoin: From Bearish to Bullish, The Market Wants ChangeChange is good, but it is not always mandatory. Change is good and recommended only when we are stuck in a certain pattern, in a certain routine or lifestyle, in a certain way of being and we want to experience growth. Exponential growth. When it comes to growth, change is awesome.
Market condition

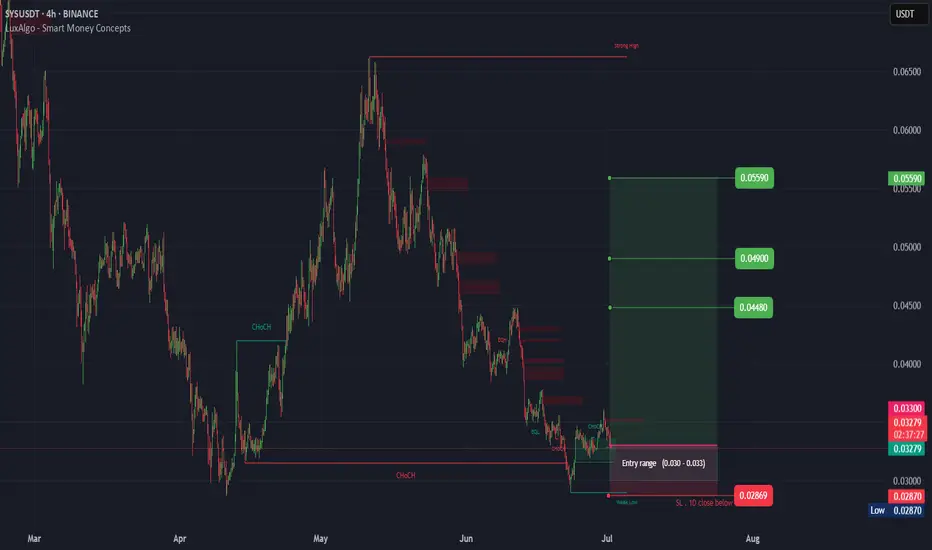
SYS (SPOT)BINANCE:SYSUSDT
#SYS/ USDT
Entry( 0.030- 0.033)
SL 1D close below 0.02869
T1 0.04480
T2 0.04900
T3 0.05900
_______________________________________________________
Golden Advices.
********************
* collect the coin slowly in the entry range.
* Please calculate your losses before the entry.
SYSUSDT | Still Weak, Resistance Holds at the Red BoxSYSUSDT continues to show fragile price action. Until the red‑boxed area is cleared with genuine volume support, every upward move remains suspect. Here’s how I’d approach it:
Expect Rejections at Resistance
The red box marks a zone where sellers have stepped in repeatedly. Unless SYS clears this l

#SYS/USDT#SYS
The price is moving within a descending channel on the 1-hour frame and is expected to break and continue upward.
We have a trend to stabilize above the 100 moving average once again.
We have a downtrend on the RSI indicator, which supports the upward move by breaking it upward.
We have a s

#SYS/USDT#SYS
The price is moving in a descending channel on the 1-hour frame and is adhering to it well and is heading to break it strongly upwards and retest it
We have a bounce from the lower limit of the descending channel, this support is at a price of 0.0474
We have a downtrend on the RSI indicator

SYS looks very bullish (1D)It seems that a diametric pattern has completed, and the price has reclaimed a key level. A pullback to this level is expected to hold as support, potentially leading the price toward higher zones.
The targets are marked on the chart, and as long as the green zone is maintained, a move toward those

SYSUSDT 1DThe price has approached the dynamic descending trendline while entering the Potential Reversal Zone (PRZ) of the Butterfly harmonic pattern. Given the confluence of technical factors and within the designated time frame marked on the chart, the conditions appear favorable for a potential bullish re

SYSSYS is a good trade for now please take the stoploss in consideration because the market is not stable

#SYS/USDT#SYS
The price is moving in a descending channel on the 1-hour frame and is adhering to it well and is heading to break it strongly upwards
We have a bounce from the lower limit of the descending channel, this support is at a price of 0.0583
We have a downtrend on the RSI indicator that is about

SYSUSDT Quick Scalp IdeaBINANCE:SYSUSDT Entry Now
SL: 4Hr close below 0.0952
Targets:
🎯 0.1002
🎯 0.1021
🎯 0.1044
Small risk.
Reason: 1 hour timeframe pullback.
Not financial advice, just a quick idea

See all ideas
Summarizing what the indicators are suggesting.
Oscillators
Neutral
SellBuy
Strong sellStrong buy
Strong sellSellNeutralBuyStrong buy
Oscillators
Neutral
SellBuy
Strong sellStrong buy
Strong sellSellNeutralBuyStrong buy
Summary
Neutral
SellBuy
Strong sellStrong buy
Strong sellSellNeutralBuyStrong buy
Summary
Neutral
SellBuy
Strong sellStrong buy
Strong sellSellNeutralBuyStrong buy
Summary
Neutral
SellBuy
Strong sellStrong buy
Strong sellSellNeutralBuyStrong buy
Moving Averages
Neutral
SellBuy
Strong sellStrong buy
Strong sellSellNeutralBuyStrong buy
Moving Averages
Neutral
SellBuy
Strong sellStrong buy
Strong sellSellNeutralBuyStrong buy
Displays a symbol's price movements over previous years to identify recurring trends.