Make it or Break itIf 135 is Broken we may see 124 & then
around 90 - 92 levels.
However, it should bounce from the 135 - 136 once till 150ish.
144.20 - 144.50 is Immediate Resistance
that needs to break & sustain.
On the flip side, if 177 is Crossed with Good
Volumes & Sustained, we may witness its
Uptrend target around 250 - 255
1321 trade ideas

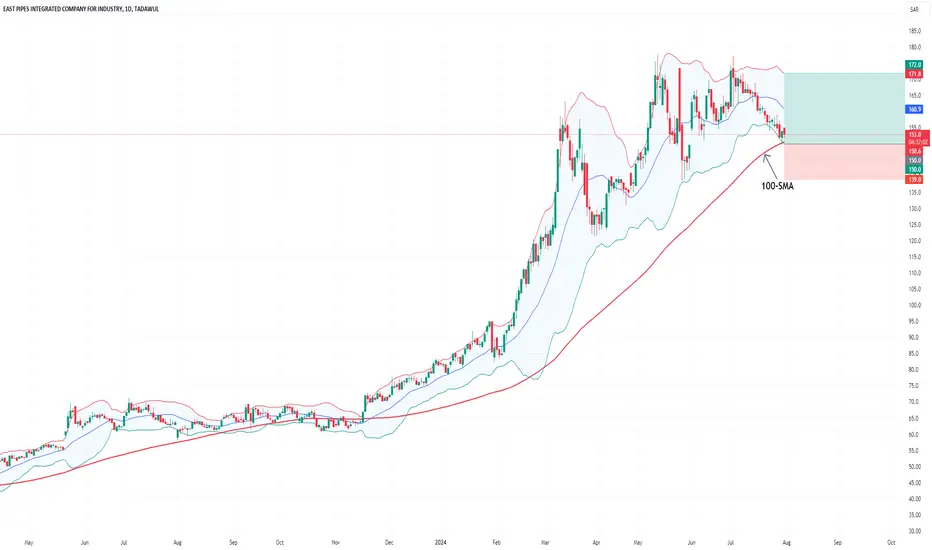
1321EAST PIPES closed at 154, staying above its 100-day SMA despite recent volatility. The RSI is at 39.65, indicating potential for a short-term increase. The stock is hovering above 200-day SMA. In the near term, the stock appears to target 160, with medium-term targets between 167 and 172. It is recommended to consider buying on weakness or as it approaches the support level, with stop losses set at 139 to manage risk effectively. Risk & Reward Ratio is 1:2
East Pipes: Trendline support; morning star (Bullish Setup)Price is moving in uptrend and recently take a correction
Price started forming HH, HL again after taking support from golden pocket
Trendline resistance breakout and retest is observed
Morning star formation at Trendline support confluence a bullish potential
Take entry with SL below 140 (aggressive), 131 (conservative)
Trail SL and enjoy the ride

1321 - 6 months RECTANGLE══════════════════════════════
Since 2014, my markets approach is to spot
trading opportunities based solely on the
development of
CLASSICAL CHART PATTERNS
🤝Let’s learn and grow together 🤝
══════════════════════════════
Hello Traders ✌
After a careful consideration I came to the conclusion that:
- it is crucial to be quick in alerting you with all the opportunities I spot and often I don't post a good pattern because I don't have the opportunity to write down a proper didactical comment;
- since my parameters to identify a Classical Pattern and its scenario are very well defined, many of my comments were and would be redundant;
- the information that I think is important is very simple and can easily be understood just by looking at charts;
For these reasons and hoping to give you a better help, I decided to write comments only when something very specific or interesting shows up, otherwise all the information is shown on the chart.
Thank you all for your support
🔎🔎🔎 ALWAYS REMEMBER
"A pattern IS NOT a Pattern until the breakout is completed. Before that moment it is just a bunch of colorful candlesticks on a chart of your watchlist"
═════════════════════════════
⚠ DISCLAIMER ⚠
The content is The Art Of Charting's personal opinion and it is posted purely for educational purpose and therefore it must not be taken as a direct or indirect investing recommendations or advices. Any action taken upon these information is at your own risk.

1321 East Pipes Integrated Company for Industry - Weak signs There is weakness signs after a good up trend:
1- Bearish Divergence
2- Bearish Break to VAWP
3- Doji candle for last month (monthly frame)
possible for 2 scenario lead to retest 200 MA

1321: EAST PIPES (TASI)Updated Values after Split on Oct 20th 2022
Breakout is observed
Series of HH, HL
Formation of HL (Retest)
Entry can be taken at current level (47.7)
Trade with SL,
Target Prices (fib levels) are mentioned, Ride the trend with trailing stop loss

1321: EAST PIPES (TASI)Breakout is observed
Series of HH, HL
Watchout for the formation of HL (Retest)
Aggressive entry can be taken at current level (74.6)
Safe entry can be taken after formation of HL
Trade with SL,
Target Prices (fib levels) are mentioned, Ride the trend with trailing stop loss
