Double Bottom with Bullish Divergence.2010 - SAUDI BASIC
CMP 55.85 (28-07-2025)
Double Bottom with Bullish Divergence.
Crossing & Sustaining 57 may lead it towards
60.
However, it should not break 53.50 now.
2010 trade ideas

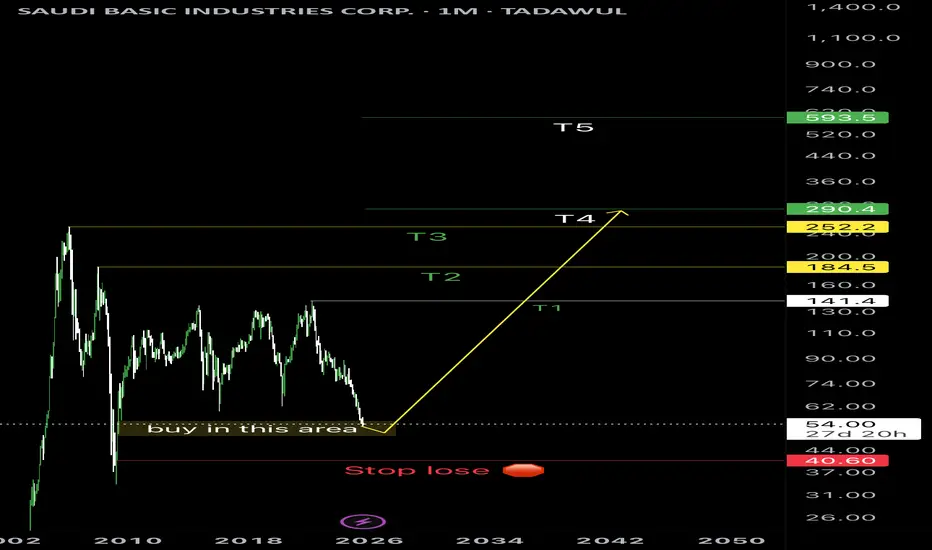
I was waiting this area from long time ago since it was on 140Every thing is clear in the chart, BUT my actual target 🎯 T4
So T1 &T2 & T3 They are just conformation for me for the mine target T4.
T5 is just extra generosity from the market if the economy conditions are good when price reaches T4.
It will be long journey.
Be patient.
Salam
2010 WILL GO FURTHER LOWER2 Months ago, I posted that 2010 will go lower but some of you didn'tlisted and contacted me saying that it won't. As usual, time proves who's right and who's wrong.
Now as you can notice on the chart, the price reached the point I told you and went further lower, now we're looking for it to reach 49.60.
DON'T BUY FOR NOW!
Meanwhile, there's a golden opportunity for those who wants to learn how to trade Saudi Market, since it is in a level where you have all the possible configuration you'll face while running low.
Let me know if you got further questions!

DONT BUY 2010 YETAs you can notice on the chart, the price is still pushing lower and lower since April 2024, for now we sill don't have an entry to take or any bullish indication, the price is still pushing lower and lower.
For the next 2 weeks, we'll see if the price will give us a confirmation of a reversal or no since it is already in a liquidity zone, don't get fooled by the big movement the market is going to the in the next couple days, that's just a manipulation.
For further questions the comment section is all yours!
Follow for more!


SABIC W1 (Trend & Volume Analysis)SABIC W1 (Trend & Volume Analysis)
The rise is with little liquidity and the fall is with great liquidity.
The price rose strongly and with high liquidity from the liquidity area around which the price revolves.
Regards,

SABIC W1 - Wave Analysis SABIC W1 - Wave Analysis
We are in wave 3 from wave c which is Ending Diagonal wave. Wave c can be from big C from triangle or wave w from big wave Y.
Regards,


POTENTIAL SETUP ( TASI : 2010 )As the market currently trading in a Parallel channel. The price was reacting well the support and resistance of channel and a market currently formed a bullish morning star candle on daily TF with a mature bullish divergence. If the market successfully sustain this buying confluence the next leg up could go for new HH.

Bullish DivergenceBullish Divergence on Weekly as
well as Daily TF.
Moving in a Rectangular Pattern;
70 should be Sustained on Monthly TF
for Further Upside.
Short Term Targets are 80 ; 83.
Long Term Targets 100+
Should Not Break 62.

2010: Buy ideaBuy idea on 2010 as you see on the chart if only if we have the breakout with force the resistance line by a big green candle.

Short Opportunity on SABIC Hello,
We've identified a Fantastic current opportunity to Short SABIC with a high probability According to my analysis on the Monthly chart .
The target is set at 60SAR within a couple of Months.
Ibrouri

BUY 2010Today I'm sharing with you one of the trades I shared with my private community,
As you can see on 2010, we have a pullback with a confirmation on the level 75.9. You can buy now with a TP and SL as sat on the chart.
For further questions and stocks to buy don't hesitate to ask!

bullish fractal for SABICI see a strong move from here in fractal way..
Still It is Nice weekly chart to follow ..

SAUDI BASIC INDUSTRIES STOCK.WEEKLY ANALYSIS.Hello ladies and gentleman,according my analysis To SAUDI BASIC INDUSTRIES STOCK .there is agreat probability long to 96 SAR.

SAUDI INDUSTRIES CORPthe SAUDI INDUSTRIES CORP is not showing interest in the take of any action so be warned

SABIC 2010 in a demand zoneSABIC is in a demand zone and the stop loss is shown. it is expected to have a good reflection at this level.

SABIC (2010) will target 102 after crossing resistanceDaily chart, SABIC (2010) stock is trading in an ascending channel for a year.
Now, it is showing positive signals for upwards movement to test the resistance line (BLUE). After crossing (around 86.3), the target will be 96, then 102
Positively, the technical indicator MACD crossed the zero line up.

saoudi basic industries holders be awarehello
first as you see on my chart resepects its evolution according to the figure so:
- if it breaks the suuport line around 65.8 it will reach 59.4 then maye be pulback toward its broken support then continue its free fall until 38.6 or more.
- otherwise it will rebond on its support and buyers can hold their stocks wishing higher levels
Remember that this support is a critical level so pay attention
NB:the horizontal blue line presents a historical level that retraces history of this stock
Keep in mind that i am not having a cristal ball predicting future but i try to be more efficient and rationnal

SAUDI BASIC INDUSTRIES CORP is Bearish with high probability!Hello ladies and gentlemen, according to my chart analysis of the SAUDI BASIC INDUSTRIES CORP stock, there is a high probability of a decline towards the level 74$ in the next days.

2010: Sell ideaon 2010 we will have a big probability to have a downtrend because as you see on the chart we have the breakout of the vwap indicator by the sellers.Thanks!

it is on its way to the target 2010we must keep entry with stop loss
entry is a good opportunity dont miss
but keep in head the stoop around the area
