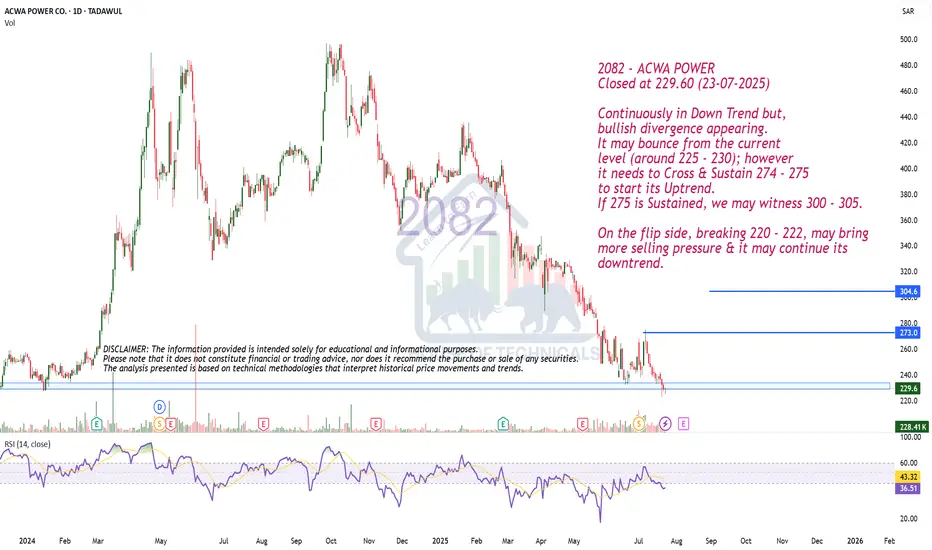
Continuously in Down Trend but..2082 - ACWA POWER
Closed at 229.60 (23-07-2025)
Continuously in Down Trend but,
bullish divergence appearing.
It may bounce from the current
level (around 225 - 230); however
it needs to Cross & Sustain 274 - 275
to start its Uptrend.
If 275 is Sustained, we may witness 300 - 305.
On the flip side, breaking 220 - 222, may bring
more selling pressure & it may continue its
downtrend.
2082 trade ideas
TECHNICAL ANALYSIS: ACWA POWER CO (TADAWUL) 22-07-2025TECHNICAL ANALYSIS: ACWA POWER CO (TADAWUL)
The stock has been in a climatic bearish trend since January this year, trending in a bearish channel marked with light pink colors. The price has continuously been trading under the 20 EMA, and the bearish momentum seems powerful.
The stock has recently broken through a historical major support marked with a red solid line at 236. This broken support is expected to act as a short-term resistance and prohibit any upward movement.
Considering the price action of the last two weeks, we don't expect an immediate upward reversal of the stock before touching the historical measuring gap level located at 201.3.
We expect the stock to touch this level and then consolidate or accumulate in a trading range before showing any signs of upward reversal.
RECOMMENDATION:
Wait for the stock's behavior at the measuring gap before making any new entries. Forecasting an upward reversal at this stage with such powerful bearish momentum would not be accurate.
KEY LEVELS:
201.3 (Historical measuring gap level)
Recent support break level (now resistance) marked with red solid line at 236

Aqua Power Flat WaveVery possible to be forming a flat wave. watching it closely when building the final down moves.

2082: ACWA POWER LONG POSITION2082:ACWA POWER seems to have potential for a long position according to ABCD Pattern BUT once price crosses 'B' level i.e. 493.4
Buy @ 493.4
SL @ 456.2; TP @ 567.8
Risk/Reward: 1:2
Good Luck!!

ACWA Power CoA "gap-down" in finance refers to the situation where the price of a financial instrument opens significantly lower than its previous closing price. Like a gap-up, this can happen due to various factors such as negative news, disappointing earnings reports, or adverse market conditions, occurring outside of regular trading hours.
For traders and investors, a gap-down presents challenges and opportunities similar to a gap-up but in the opposite direction. Long positions may face losses, while short positions might gain. However, just as with a gap-up, there's uncertainty about whether the downward momentum will persist or reverse.
Traders often analyze the reasons behind the gap-down and consider factors such as trading volume, market sentiment, and technical indicators to make informed decisions about their positions. Risk management becomes crucial in such scenarios to mitigate potential losses.

ACWA POWER is getting exhaustedACWA POWER is getting exhausted from pushing up you may sell what you have bought and even forecast a sell for the coming times

Chart of the week Acwa Power. Tadawul IndexThis stock came to my attention somewhere in April 22. Since then I was waiting for this stock to break high made on 3 April 22. 2 weeks before the stock gave closing above 189 then came down to test the support and last week again gave breakout. Now the stock looks like to give up move once again. The targets as per Fibonacci are as follows
CMP - 193 (26/8/23)
T - 226, 287 W
SL - 175 W

ACWA 2082: Cup & Handle formation (Bullish Setup)Cup and Handle Formation is in action.
Trade with specified stop loss.
Trail SL to ride the trend.
Manage risk properly before taking trade.

ACWA POWER A short trade can be taken with stop loss
Formation of HH, HL
Breakout of trendline/Falling Wedge
Completion of Harmonic Pattern
Trail stop loss

ACWA POWERTrendline Breakout
Formation of HH,
HL in process
Trade with Stop Loss (slightly below 134.5)
Entry @ current price (138) or 137
TP levels as per fib levels
Trail your stop loss

TASI, 2082: ACWA1- Series of HH, HL --> Bullish Trend; Dow Theory
2- Above Trendline Support
3- Every time it hits trendline support, it takes upside movement
4- Biased: Bullish
Buy @ 160.8
SL @previous HL: 145.75
TP1 @ 180.5
TP2 @ 187.5

TASI, 2082: ACWATrendline resistance breakout. (Confirmation of false breakdown)
Setup is ready for long.
1- Series of HH, HL --> Bullish Trend; Dow Theory
2- Above Trendline Support
3- Every time it hits trendline support, it takes upside movement
4- Biased: Bullish
Buy @ current level (164.4)
Buy after retest of trendline (162), confirmation of HL
Tight SL @ 153.25
or previous HL@ 145.4
Targets slightly below fib levels
TP1 @ 180.5
TP2 @ 187.5
or as per RR 1:2, 1:3
Ride the trend with trailing stop loss

2082 ACWA POWERAs per chart analysis, the Price is going 200 SAR
First Target 200 SAR
Second Target 220 SAR
Stop loss 160 SAR

(2082) ACWA POWER can be predicted for future, {"_"}.(2082) ACWA POWER in the future this chart will be updated,
if you want me to analyze your stock feel free to contact me private {"_"}.

2082 ACWA PowerRSI Positive
50 EMA Positive
Volume Increased
Let's watch and see
Follow, Like & Comment

High RS for ACWA POWER 2082TADAWUL:2082
- Symmetrical Triangle Pattern (VCP) with tightness candle weekly or daily.
-High Relative strength compare to TASI .
-Many breakouts with high volumes, as shown in the chart.
-If it breaks resistance, it will probably be a good chance for a long position.
- 3 July 2022 will be Earning call. You should be cautious.
-You need fundamental analysis to build your high convection .
*ONLY FOR EDUCATIONAL PURPOSE , NOT SUGGESTED TO TRADE

ACWA powerFirst target is 155.
Not sure about second target depends on volume.
Anyway it is a good stock.

Bearish DivergenceIts been going higher and higher but now its time for some rest, a retest of support zone is expected soon and that will be buying opportunity. Also we can see a bearish divergence on the daily chart. So dont make a mistake of have a FOMO at this time. Market will give you a chance just be patient.
Hit like & follow guys;)

20 82 is predictable just see my charthello,
here as it is shown on my chart the stock is into a critical area: if it is broken down targets are shown on the chart, otherwise if brokn up targets are also shown there,
what you should do is keeping eyes on confirmation of volume importance.
good luck

BUYING IS MORE ADVISED THAN SELLING
Hello traders and investors
if you are buyer keep your position, if not try to buy if the highest record is boroken
i tried to put all recommandations on my chart so be carefull.
thank you
NB: Remember that i do not have cristal ball predicting markets future but i try with you to have some idees and know reacting efficiently and rationally
please do not foregt making follows and likes if i deserve it .
