2160 Saudi Arabian Amiantit Co.Hello Traders,
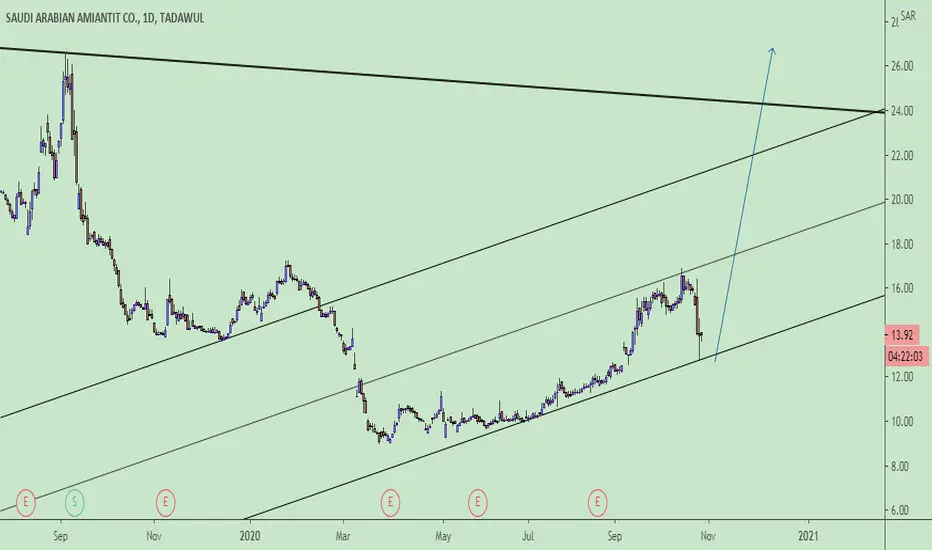
One of my favorite Saudi stock is Amiantit Co,
It clears analysis,
Good Luck for all
2160 trade ideas

Saudi Arabian Amiantit Co (2160) - Trade Idea📌 Saudi Arabian Amiantit Co (2160) - Trade Idea
📊 Market Behavior:
Price always follows one of two paths:
1️⃣ Offering Fair Value – Where price stabilizes and attracts buyers/sellers at a justified level.
2️⃣ Seeking Liquidity – Where price hunts stop losses, liquidates positions, and manipulates emotions.
🔥 Current Phase:
Right now, the market is in a liquidity-seeking phase 🏃♂️💨, where it is:
✅ Shaking out weak hands (retail traders getting stopped out).
✅ Creating a manipulation leg (to trap traders before a reversal).
✅ Grabbing liquidity from key levels (before moving towards fair value).
🎯 Main Target:
🚀 The Yearly Fair Value Gap (FVG) is the ultimate target, where price is likely to rebalance and provide high-probability trading opportunities.
⚠️ Key Takeaways:
🔹 Expect volatility – market makers are engineering liquidity.
🔹 Stay patient, avoid emotional reactions.
🔹 Smart money moves in phases – follow the narrative.
💡 Execution Plan: Wait for confirmation before entry, align with smart money, and target high-probability zones! 🎯🔥
📈 Trade Smart, Stay Ahead! 💎🚀


2160A symmetrical triangle is a chart pattern used in technical analysis that typically forms during a trend as a continuation pattern. It is characterized by two converging trendlines connecting a series of sequential peaks and troughs. The upper trendline is downward sloping, while the lower trendline is upward sloping. Here are some key points about symmetrical triangles:
Formation:
Symmetrical triangles occur when the price action of an asset is consolidating and moving into a tighter range.
It consists of two trendlines: one descending (upper) and one ascending (lower), which converge to form a triangle.
Volume:
Volume usually decreases during the formation of the pattern, indicating a period of consolidation.
Volume should then increase as the price breaks out of the triangle, confirming the breakout direction.
Breakout Direction:
The breakout can occur in either direction (up or down).
The direction of the breakout often continues the prior trend, but it can also signify a reversal.
Trading the Pattern:
Traders often look for a breakout above the upper trendline or below the lower trendline to enter a trade.
The target price after the breakout can be estimated by measuring the height of the triangle at its widest part and projecting that distance from the breakout point.
Reliability:
Symmetrical triangles are considered neutral patterns and require confirmation through breakout direction.
It's important to use other technical indicators or patterns to confirm the breakout to avoid false signals.

2160 - in progress triangle waveIt is expected that it has finished the c wave and is in the process of targeting the d wave from a triangle...
d-wave is expected to be targeted at 28-29 zones..


SAUDI ARABIAN AMIANTIT in weekly chart Hello to all tradingview investors, according to my previous analysis I see a great opportunity with good probability, the details are reflected in the chart, greetings and good luck to all

Amiantit 2160I expect good move in this area. Good luck and remember that's not advise for investment, make your own analysis bro :)

if 2160 breaks these 2 levels buyers will be happyHello
If 2160 breaks these 2 levels buyers will be happy.
As you see on my chart, 2160 has reached its historical low price, and normally shoud recover its health.
I said always that i am not having a cristal ball to predict markets future but i am trying to be more efficient and rational during my trading.
Good luck and if you need more analysis i will be glade to answer you