Saudi Dairy 2270 - To target 439 after beating Resistance Daily chart, the stock TADAWUL:2270 is trading between support and resistance lines S and R respectively. Closing above R for 2 days, the price will target 417 then 439
The breakout may happen around 385
Technical indicator MACD signals a minor correction may happen soon.
RSI is indicating a bullish movement.
Below support line S is a stop loss.
2270 trade ideas

2270 Saudi Dairy to target 422 after crossing 330Daily chart, stock is crossing the triangle, and is targeting 422 passing through resistance levels as shown.
RSI and MACS support this view.
Stop loss should be considered at 310

SAUDIA DAIRY AND FOODSTUFF COA "bullish Gartley" refers to a specific pattern that traders look for in financial markets, particularly in technical analysis, to potentially predict future price movements. It's named after its creator, H.M. Gartley, who introduced it in his book "Profits in the Stock Market" in 1935.
The bullish Gartley pattern is a harmonic pattern that consists of four distinct price swings or legs. These legs are labeled XA, AB, BC, and CD. The pattern typically forms after a significant downtrend and indicates a potential reversal to the upside.
Here's a breakdown of the legs of a bullish Gartley pattern:
1. XA: This is the initial leg of the pattern and represents the initial impulse move downward.
2. AB: After the XA leg, there is a retracement upward, forming the AB leg. This retracement should ideally reach a Fibonacci level of either 0.618 or 0.786 of the XA leg.
3. BC: Following the AB leg, there is another downward move forming the BC leg. This leg typically retraces 0.382 or 0.886 of the AB leg.
4. CD: Finally, the pattern completes with the CD leg, which is an extension of the BC leg. The CD leg should ideally reach the 1.272 or 1.618 Fibonacci extension of the BC leg.
When the CD leg completes near the Fibonacci extension levels, it suggests that the pattern is complete and a bullish reversal may occur. Traders often look for additional confirmation signals such as candlestick patterns, volume analysis, or other technical indicators before entering a trade based on the bullish Gartley pattern.
As with any technical analysis tool, it's important to remember that the bullish Gartley pattern is not foolproof and should be used in conjunction with other analysis methods and risk management strategies.

SADAFCO 2270 Review: Proceed with Caution ⚠️Beware
INTERMIDIATE term HIGH being created TARGET SELL SIDE LIQUDITY

📈 **SADAFCO Stock Soaring: Bullish Run Ahead!**📈 **SADAFCO Stock Soaring: Bullish Run Ahead!**
Attention, investors! 🚀 Get ready for a thrilling ride as we unpack the exciting prospects for SADAFCO stock. 🐂
🌟 **Bright Beginnings:** Imagine a sunrise signaling a new day – that's SADAFCO's bullish run! The stock's showing potential to rise and shine. ☀️💼
📈 **Upward Momentum:** Like a jet taking off, SADAFCO's stock is gaining momentum. Positive news and growing demand are fueling this upward surge. 🛫🚀
💰 **Investor Enthusiasm:** Picture investors as excited fans at a concert. They're showing up with energy, believing SADAFCO's future is set to rock. 🤘🙌
📊 **Strong Fundamentals:** Think of SADAFCO's foundation as solid rock. Healthy financials, strategic moves – all playing a tune that says "potential profits." 🎶🏛️
🌐 **Growing Reach:** Imagine SADAFCO expanding its reach like a web spreading wide. New markets, increased sales – it's like the world is tuning in to its success story. 🌐🌍
🏆 **Potential Peak:** Visualize reaching the peak of a mountain – that's the goal! SADAFCO's stock is aiming high, and investors are climbing for the summit. ⛰️🏞️
Remember, the market's a roller coaster, but SADAFCO's bullish run could be your golden ticket. Do your research, consult experts, and buckle up for a thrilling journey! 🎢🎫📈
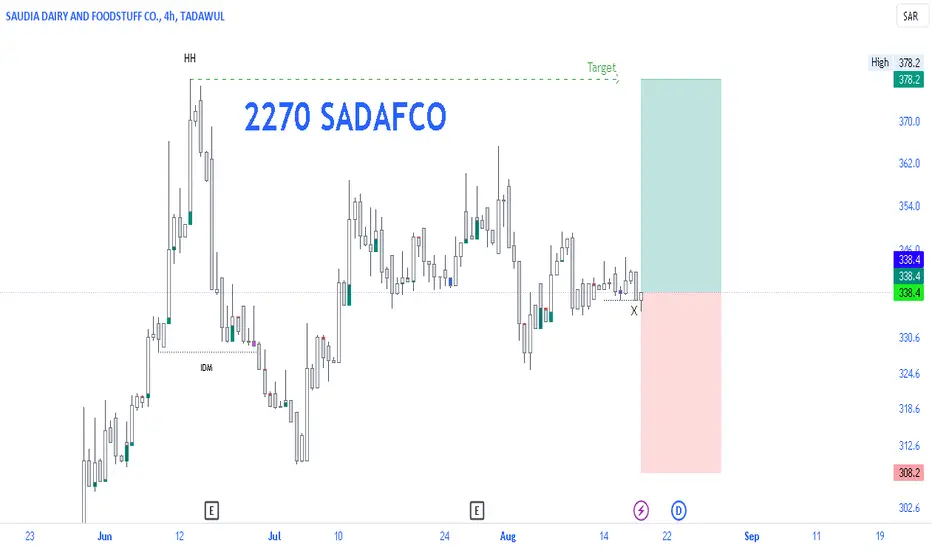
2270 SADAFCOEVERY CANDLE HAS LIQUIDITY.
PRICE ALWAYS NEED LIQUIDITY.
Nobody Knows Where is Price Going.
Hey traders, here is the analysi.
If you guys like my analysis please hit like?? and follow.
Thanks.
DISCLAIMER- This is not financial advice.
SMART MONEY CONCEPT.
identify Liquidity Or Become Liquidity

SAUDIA DAIRYSaudi Dairy has been in a bullish trend
The bulls seem exhausted & The bears took control
A rising wedge pattern foundation is formed on the top of the trend, which indicates the trend reversal
short entry with sell stop order by breaking the neckline
DISCLAIMER- This is not financial advice.

SAUDI DAIRY TASIHey traders, here is the analysi.
If you guys like my analysis please hit like👍 and follow.
Thanks.
DISCLAIMER- This is not financial advice.
SMART MONEY CONCEPT

2270 : SADAFCO (+50% by December 2022)Macro analysis for Saudi Diary and Food Company,
The chart indicates a bull macro trend since 2008 from H&S bottom to the top in 2017 that sent it to the bottom of the trend channel in 2018. Since then the stock has been in a pull pattern.
Since recent weeks the chart has been in accumulation pattern around 170-177 SAR. It now broke above and is going for targets at 210 SAR (+23%) with potential even to achieve 50% at the top of trend channel by year end.
