TASI-2350: SAUDI KAYAN PETROCHEMICAL COMPANYShot-term Bullish Retracement for TASI-2350: Saudi Kayan Petrochemical Company
Buy-1 at 6.92 and Buy-2 at 6.87 with Stop Loss at 6.82
TP-1 = 6.98, TP-2 = 7.02
2350 trade ideas


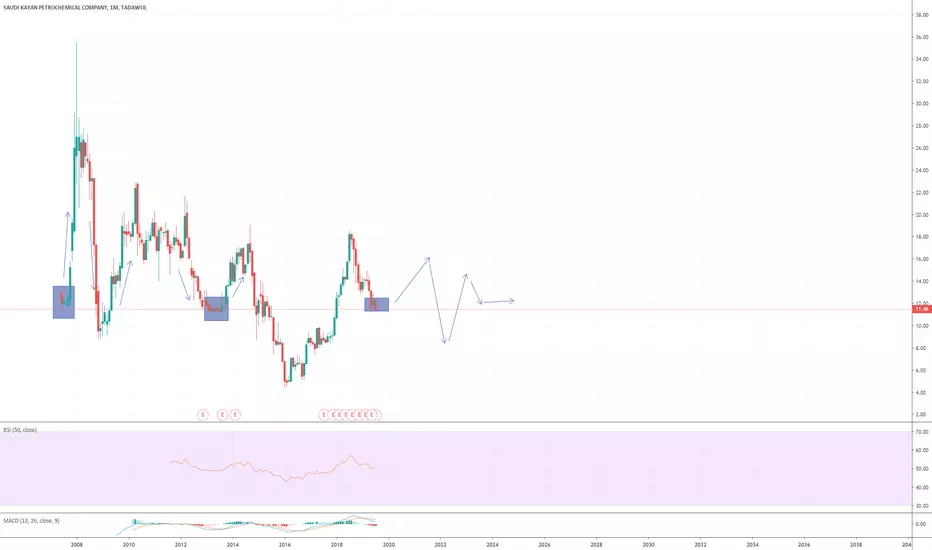
Saudi Kayan, to target 14 and 16Saudi Kayan (2350), on the daily chart, I see a forming pattern, going up on a zigzag until 14, then some correction and next target is 16
Quick tradings can be done buy at support / sell at resistance, and so on until reaching the target.
The technical indicators RSI and MACD are supporting this view.
Stop loss at 10.7 should be considered.

2350_Trendline Breakout (Bullish Setup)Price has taken support at C&H formation target.
HH, HL in formation.
Price has reached a strong horizontal level (acting as resistance)
Take Entry after Breakout of horizontal level (Resistance); will be converted to support.
SL and TPs are specified.
Trail stop loss accordingly.


2350: SAUDI KAYAN_TASI (Parallel Channel Breakout)Parallel Channel Breakout Observed
Completion of Cup & Handle Target
Short term and long term Bullish setup is available
Wait for HH, HL formation
Entry above watchout level
Horizontal support Levels are specified for TPs
Ride the trend and Trail your stop loss
Manage your risk properly

Analysis: Buy ideaWe have a high probability that the market will go up because after the breakout of the vwap indicator you see that the sellers have hit the support line without being able to break it.Thanks.!

2350: SAUDI KAYAN_TASI (Channel Breakout)Descending Parallel Channel Breakout and Retest
Inverted Cup & Handle formation
Support from 50 EMA
Crossed Strong Horizontal Support/Resistance Line
Series of HH, HL formation
Trade with stop loss
Ride with trailing stop loss

2350: SAUDI KAYAN_TASI
Watch for Triangle Breakout
Take Entry with stop loss @ Triangle Top
Trail Stop Loss for TPs as per fib levels

2350: TASIWait for Target completions for Long Entry
Watchout for
Horizontal Supports,
Cup & Handle Patterns Targets,
Ascending Triangle Breakdown targets

Saudi Kayan 2350, LongTrending up and continue trending in channel. Give respect to Stop Losses and Trailing Stop Loss.
Entry 19.16
SL 18.70


SAUDI KAYAN PETROCHEMICHAL CO Buy Signal To Watch (2350)Recently , TADAWUL:2350 had enough bullish strength to break above the black line .
If we close in an upcoming day considerably above the green area (significantly above the 8.8 ) , this stock would very likely continue up towards the first blue rectangle area at the 9.8-10 area , with an important potential to reach the second target at the secong blue rectangle (11.2-11.7 area).
The probability of reaching the second blue rectangle area is considerable but it would depend also on how price will act around the first blue rectangle area (9.8-10 ) .

SAUDI KAYAN PETROCHEMICAL COthis Market not for sell this period , he can back to the support line for pullBack then goingUp ( strong support line not easy to cross it )