3005an upward trend in the prices of an industry's stocks or the overall rise in broad market indices, characterized by high investor confidence
0.80 SAR
47.72 M SAR
265.59 M SAR
49.23 M
About UMM AL-QURA CEMENT CO.
Sector
Industry
CEO
Mohamed Fadl Kamel Al-Hawi
Website
Headquarters
Riyadh
Founded
2013
ISIN
SA13I051EUH6
FIGI
BBG006F51QN4
Umm Al-Qura Cement Co. engages in the management and operation of cement plants for the production of cements. It offers cement finishing and ordinary Protland, Buzlana, and resistant cements. The company also involves in the installation, mechanical, and electrical works, as well as general construction works for buildings. Umm Al-Qura Cement was founded on July 4, 2013 and is headquartered in Riyadh, Saudi Arabia.
Related stocks

targeting the 0.5I'm in at 25.45
price is above the cloud, good chance we get a green twist soon to possibly push the price higher to the 0.5 fib level. I love it in here for many other reasons. lets see how it plays.

Umm Al Qura CementThis is not a recommendation for buying or selling this stock, it is just a technical analysis based on the public available data only.
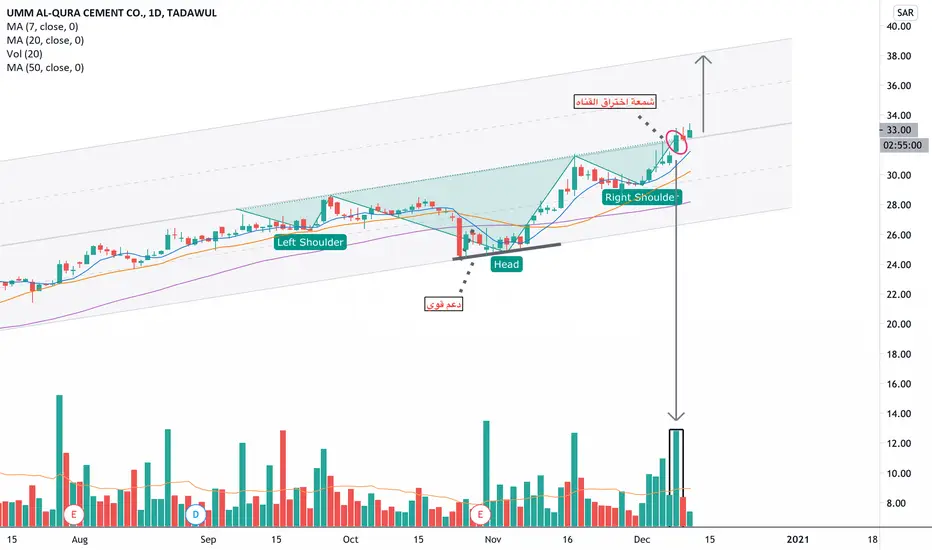
UMM AL-QURA is in decisive Triangle !After 5 impulsive waves to the down side, the market is correcting now.
We are waiting for a breakout of the triangle before seeing price flying in one Direction.


See all ideas
Summarizing what the indicators are suggesting.
Oscillators
Neutral
SellBuy
Strong sellStrong buy
Strong sellSellNeutralBuyStrong buy
Oscillators
Neutral
SellBuy
Strong sellStrong buy
Strong sellSellNeutralBuyStrong buy
Summary
Neutral
SellBuy
Strong sellStrong buy
Strong sellSellNeutralBuyStrong buy
Summary
Neutral
SellBuy
Strong sellStrong buy
Strong sellSellNeutralBuyStrong buy
Summary
Neutral
SellBuy
Strong sellStrong buy
Strong sellSellNeutralBuyStrong buy
Moving Averages
Neutral
SellBuy
Strong sellStrong buy
Strong sellSellNeutralBuyStrong buy
Moving Averages
Neutral
SellBuy
Strong sellStrong buy
Strong sellSellNeutralBuyStrong buy
Displays a symbol's price movements over previous years to identify recurring trends.
Frequently Asked Questions
The current price of 3005 is 15.85 SAR — it has decreased by −0.13% in the past 24 hours. Watch UMM AL-QURA CEMENT CO. stock price performance more closely on the chart.
Depending on the exchange, the stock ticker may vary. For instance, on TADAWUL exchange UMM AL-QURA CEMENT CO. stocks are traded under the ticker 3005.
3005 stock has fallen by −0.19% compared to the previous week, the month change is a −0.94% fall, over the last year UMM AL-QURA CEMENT CO. has showed a −4.06% decrease.
3005 reached its all-time high on Aug 26, 2014 with the price of 50.75 SAR, and its all-time low was 10.30 SAR and was reached on Oct 14, 2018. View more price dynamics on 3005 chart.
See other stocks reaching their highest and lowest prices.
See other stocks reaching their highest and lowest prices.
3005 stock is 1.96% volatile and has beta coefficient of 0.99. Track UMM AL-QURA CEMENT CO. stock price on the chart and check out the list of the most volatile stocks — is UMM AL-QURA CEMENT CO. there?
Today UMM AL-QURA CEMENT CO. has the market capitalization of 871.75 M, it has decreased by −1.91% over the last week.
Yes, you can track UMM AL-QURA CEMENT CO. financials in yearly and quarterly reports right on TradingView.
3005 net income for the last quarter is 10.91 M SAR, while the quarter before that showed 7.67 M SAR of net income which accounts for 42.28% change. Track more UMM AL-QURA CEMENT CO. financial stats to get the full picture.
UMM AL-QURA CEMENT CO. dividend yield was 0.00% in 2024, and payout ratio reached 0.00%. The year before the numbers were 0.00% and 0.00% correspondingly. See high-dividend stocks and find more opportunities for your portfolio.
EBITDA measures a company's operating performance, its growth signifies an improvement in the efficiency of a company. UMM AL-QURA CEMENT CO. EBITDA is 113.63 M SAR, and current EBITDA margin is 44.39%. See more stats in UMM AL-QURA CEMENT CO. financial statements.
Like other stocks, 3005 shares are traded on stock exchanges, e.g. Nasdaq, Nyse, Euronext, and the easiest way to buy them is through an online stock broker. To do this, you need to open an account and follow a broker's procedures, then start trading. You can trade UMM AL-QURA CEMENT CO. stock right from TradingView charts — choose your broker and connect to your account.
Investing in stocks requires a comprehensive research: you should carefully study all the available data, e.g. company's financials, related news, and its technical analysis. So UMM AL-QURA CEMENT CO. technincal analysis shows the sell today, and its 1 week rating is strong sell. Since market conditions are prone to changes, it's worth looking a bit further into the future — according to the 1 month rating UMM AL-QURA CEMENT CO. stock shows the sell signal. See more of UMM AL-QURA CEMENT CO. technicals for a more comprehensive analysis.
If you're still not sure, try looking for inspiration in our curated watchlists.
If you're still not sure, try looking for inspiration in our curated watchlists.