Extremely Bullish.
Extremely Bullish.
Took Support from a very Important level around 136 - 140.
Hidden Bullish Divergence has appeared.
176 - 182 is a Resistance Zone.
Crossing & Sustaining 201, lead it towards 235 - 237.
On the flip side, 170 & 161 - 162 seems to be a Good Support level.
4015 trade ideas

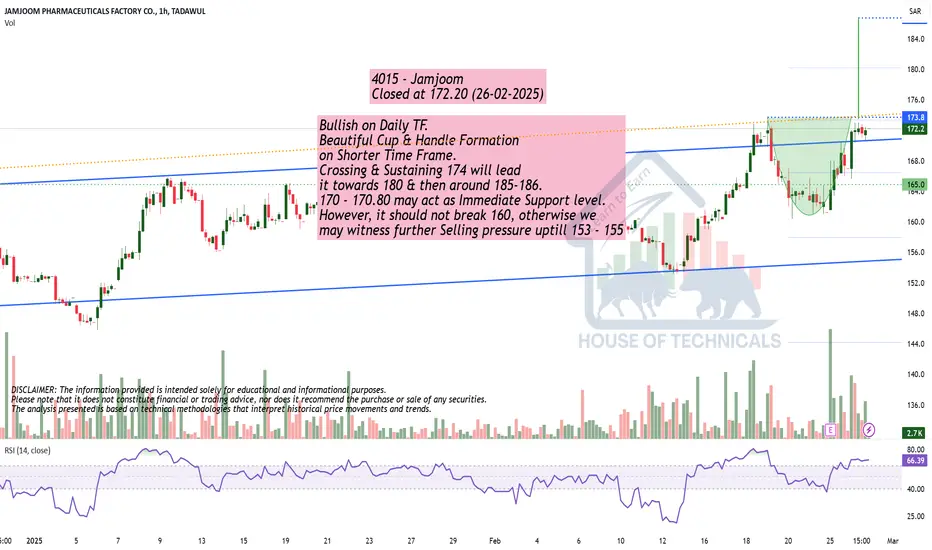
Bullish on Daily TF.Bullish on Daily TF.
Beautiful Cup & Handle Formation
on Shorter Time Frame.
Crossing & Sustaining 174 will lead
it towards 180 & then around 185-186.
170 - 170.80 may act as Immediate Support level.
However, it should not break 160, otherwise we
may witness further Selling pressure uptill 153 - 155
4015: Correction (Watchout for reversal_Golden Pocket??)4015
Continuously forming HH and HL
Bullish Flag Pole and C&H target complete
Bearish Divergences are appearing on Daily and Weekly time frames.
Candlesticks on weekly are clearly showing dominance of bears
A correction is expected.
Price currently at Golden Pocket, Watchout for reversal

4015: Breakout and Retest Parallel ChannelPrice moving in uptrend; HH, HL formation
Parallel Channel breakout and retest is observed
Watchout for double top formation
beating ATH will take the price to Bullish Flag Target.

4015: Neckline BreakoutPrice is moving in Cup formation (continuous formation of HH, HL)
A significant Neckline (Resistance) is broken.
Wait for retest for a conservative entry.
Trade as per risk.


Making HH HL on Daily TF.
Bullish on All Time Frames.
However, Slight Bearish Divergence on Hourly TF;
which may bring the price towards 144.50 -145.50
& then around 136 - 137.
Important Resistance around 158 -159.
Sustaining 159 with Good Volumes will expose
New Highs, may be around 180s.
Note that Initial Resistance is around 153
that needs to be Sustained to neglect the
Bearish Divergence.

Jamjoom
A bearish butterfly is a specific chart pattern used in technical analysis within the realm of Harmonic Trading. This pattern helps traders identify potential reversal points in the price of an asset, typically indicating that the asset's price may reverse from an uptrend to a downtrend.
Key Features of the Bearish Butterfly Pattern
The bearish butterfly pattern consists of five points labeled X, A, B, C, and D. The pattern is formed by four distinct price swings, creating specific Fibonacci retracement and extension levels.
X to A: The initial move up from point X to point A.
A to B: A retracement move down from point A to point B, which is typically 78.6% of the XA leg.
B to C: A move up from point B to point C, which is usually 38.2% to 88.6% of the AB leg.
C to D: The final move down from point C to point D. The CD leg is an extension of the XA leg, and D is often found at 127.2% to 161.8% of the XA leg.

4015 JAMJOOMStop Buying
4015 JAMJOOM Pharma
monthly bisi>monthly imbalance created>ltf Confermation.
Target mention on chart.

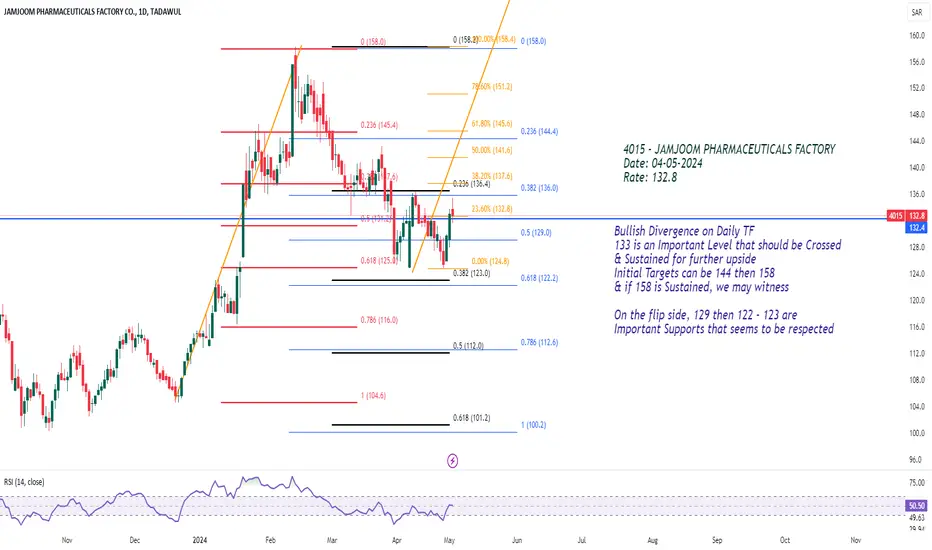
Bullish Divergence on Daily TF
133 is an Important Level that should be Crossed
& Sustained for further upside
Initial Targets can be 144 then 158
& if 158 is Sustained, we may witness
On the flip side, 129 then 122 - 123 are
Important Supports that seems to be respected
4015_Possible Trend reversal (Bullish setup)4015
**Bullish Points:**
Price at significant support level (Volume profile) confluence with 78% fib level
Bullish divergence is observed
Small entry can be taken now (Aggressive)
Further entry can be taken after descending channel breakout, or
at next support level 118.6 (DCA strategy)
**Bearish Points:**
Price is moving in downtrend, series of LH/LL
H&S pattern breakdown and retest of neckline
Current stop loss is specified
Trail stop loss if price goes up
Place SL below 118 (DCA strategy)

Bullish Divergence on Hourly TF
133 is an Important Level that
should be Crossed & Sustained
for further upside
On the flip side, 122 - 123 is
an Important Support that
seems to be respected

4016 Longset up an Anchor VWAP from the last bottom and re test this vewap. the ieda is is long after announcing good finance reporting

forcasting up wardafter franchising this important level with an interesting momentum the JAMJOOM is tending to stay up this area and keeps moving up

4015: Jamjoom Pharma (Sideways)_Short Bullish SetupPrice has taken support from parallel channel bottom which is a strong support/fib ret level.
Breakout from trendline is observed
Trade with SL

✅ 4015 JAMJOOM PHARMA 🔥NO LIQUDITY SWEAP NO ENTRY.
STRUCTURE IS CHANGING ANYTIME.
EVERY CANDLE HAS LIQUIDITY.
PRICE ALWAYS NEED LIQUIDITY.
Nobody Knows Where is Price Going.
Hey traders, here is the analysi.
If you guys like my analysis please hit like?? and follow.
Thanks.
SMART MONEY CONCEPT.
identify Liquidity Or Become Liquidity
DISCLAIMER- This is not financial advice.

Three white soldiersJamjoom Pharma Will make three white soldiers pattern ??
The three soldiers candlestick pattern is a relatively simple pattern to identify
It can be used to confirm other bullish signals
However, it is important to remember that no technical indicator is 100% accurate, so it is always important to use your own judgment when trading.
