4081 trade ideas
4081 Naifat Finance (TADAWUL)📊 Trade Idea Overview – Weekly Timeframe
✅ Key Technical Levels:
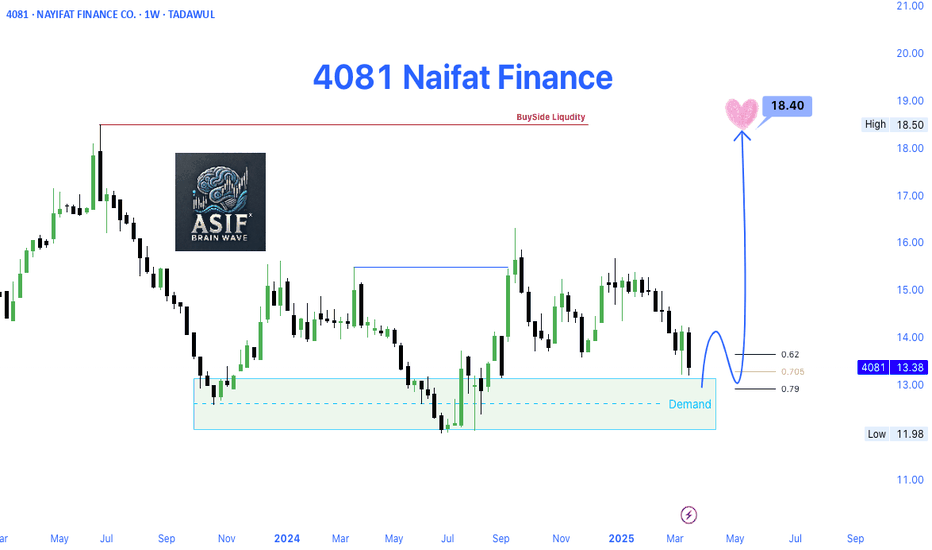
Demand Zone: Clearly marked between 12.00 – 13.00, showing strong historical buyer interest.
Current Price: 13.38
Fibonacci Retracement Levels: Price is reacting near the 0.705 - 0.79 zone, which often acts as a bullish reversal area.
Target Price: 18.40 — Identified as Buy-Side Liquidity Zone (BSL) and a previous significant high.
Resistance Zone: Around 18.40, where liquidity is likely to get captured by smart money.
📌 Narrative & Market Context:
Price has shown a bullish reaction from the Demand Zone, indicating accumulation or potential bottom formation.
Fibonacci confluence with demand strengthens the bullish setup.
Once price breaks above 14.00, a bullish market structure shift will be confirmed.
The chart also visualizes a projected path toward 18.40, indicating a strong bullish impulse wave ahead.
📈 Expected Price Path (as shown in chart):
Minor pullback toward 13.00 area (retest demand / Fibonacci zone).
Breakout above 14.00 – a key structural shift.
Bullish continuation toward 18.40 Buy-Side Liquidity.
📍 Trading Plan Suggestion:
Entry Zone: Between 13.00 – 13.20 (ideal demand re-entry).
Stop Loss: Below 12.00 (invalidate demand structure).
Take Profit: 18.40
Risk-Reward Ratio: Excellent (Potentially 1:3+ R:R)
Review of Nayifat Finance Co's Analysis 4081
Nayifat Finance Co. has demonstrated a robust analytical approach in their recent market assessment. Their focus on key trading concepts, including sell-side liquidity, buy-side liquidity, and market structure shifts, reflects a comprehensive understanding of market dynamics.
Sell-Side Liquidity Analysis: The company effectively identified the 4081 level where sell-side liquidity was taken out. This precise observation is crucial for understanding potential market shifts and making informed trading decisions.
Monthly Target Achievement: Nayifat Finance Co. set a clear monthly target, aligning their strategies with the broader market objectives. Their ability to achieve this target suggests a well-executed plan and accurate market predictions.
Buy-Side Liquidity Focus: The assessment of buy-side liquidity and the creation of Fair Value Gaps (FVGs) demonstrate an in-depth analysis of market trends. This approach helps in identifying potential buying opportunities and market entry points.
Market Structure Shifts: The identification of a market structure shift is a critical component of their analysis. This insight into structural changes within the market is essential for adjusting strategies and capitalizing on new opportunities.
Projection Deviation and Confirmation: The company's projection deviations were well-conceived, with confirmation of targets enhancing the reliability of their predictions. This aspect underscores their ability to adapt and refine strategies based on evolving market conditions.
Overall, Nayifat Finance Co. has provided a thorough and insightful review of market dynamics, showcasing their expertise in forex trading and technical analysis. Their methodical approach to liquidity analysis and market structure shifts positions them as a strong player in the financial sector.
4081 NAYIFAT FINANCENO LIQUDITY SWEAP NO ENTRY.
STRUCTURE IS CHANGING ANYTIME.
EVERY CANDLE HAS LIQUIDITY.
PRICE ALWAYS NEED LIQUIDITY.
Nobody Knows Where is Price Going.
Hey traders, here is the analysi.
If you guys like my analysis please hit like?? and follow.
Thanks.
SMART MONEY CONCEPT.
identify Liquidity Or Become Liquidity
DISCLAIMER- This is not financial advice.
possible scenarios for 4081 Hello traders and investors
As it is figured on my chart there are 2 scenarios, so what you should keep on mind it is the fact that one of these 3 zones should be broken with huge volume and a nice big candle.
We don't have a cristal ball predicting markets but we try to follow the decided market trend.
Be aware and do not resist from a loss, if it's the case close your trade when you feel that the mathematic expectancy of winning becomes low.
good luck
please don't hesitate either to comment my post and ask me if needed
4081 can reverse up after that big rise4081 after reversing up strongly it can, if break up the 33.06 feriously, go up until 34.12 and mybe more just during few days ( this hypothisis is likely hard to be achieved but possible)
otherwise if the other scenario accure it will fall down freely and rapidly during several weeks (that what i supose to happends on first place)
So be aware. larket will decide
good luck


