4150 | Bullish Dragon PatternArriyadh Development Company (4150) - Technical Analysis
Pattern: Bullish Dragon Pattern
Context:
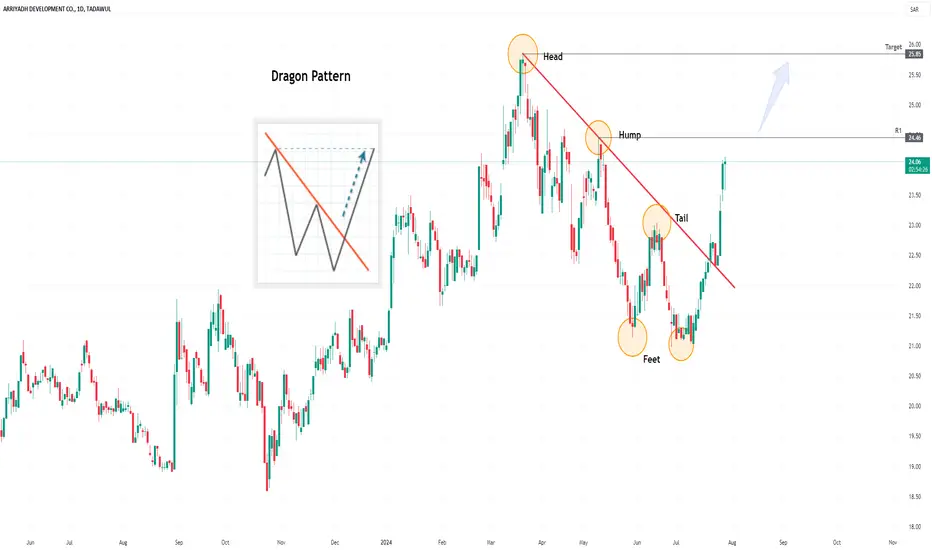
Previous Trend : The stock price was in a downtrend since reaching a peak of SAR 25.85. During this downtrend, the price made lower lows and lower highs, resting around SAR 21.
Breakout : A breakout was observed from the descending trend line.
Pattern Details:
First Candle : Long bearish candle during the downtrend.
Second Candle : Small-bodied candle that gapped down.
Third Candle : Long bullish candle that closed above the trend line at approximately SAR 22.70.
Support : After the breakout, the price reset and established support around SAR 22.34.
Potential Reversal : The formation indicates a potential reversal to an uptrend.
Resistance and Target:
Initial Resistance : SAR 24.46
Target : Upon breaking the initial resistance of SAR 24.46, the price may test the previous top of SAR 25.85.
4150 trade ideas
4150 ARRIYADH DEVELOPMENT CONO LIQUDITY SWEAP NO ENTRY.
STRUCTURE IS CHANGING ANYTIME.
EVERY CANDLE HAS LIQUIDITY.
PRICE ALWAYS NEED LIQUIDITY.
Nobody Knows Where is Price Going.
Hey traders, here is the analysi.
If you guys like my analysis please hit like?? and follow.
Thanks.
SMART MONEY CONCEPT.
identify Liquidity Or Become Liquidity
DISCLAIMER- This is not financial advice.


The Rounding Bottom The daily chart shows a cup and handle pattern on the Arriyadh Development Company stock.
Once it breaks the resistance, it can go the supply area around 23

Cup & Handle pattern The daily chart shows a cup and handle pattern on the Arriyadh Development Company stock

The deal closed ARRIYADH Development in TADAWUL KSA with profitAlhamdulillah , The deal was closed on ARRIYADH Development Co. ( 4150 ) in TADAWUL KSA with a profit of 5.61% in a 1 week . I wish good luck to everybody.

BUY ARRIYADH Development Co. ( 4150 ) in TADAWUL KSA 10/8/2022You can buy it Target 23.77 and 25 stop loss 21.2 money management is your responsibility . good luck


GOOD SHORT TERM SIGNAL - ARRIYADH DEVELOPMENT COMPANY - TASITADAWUL:TASI TADAWUL:4150 A solid short term gain for anyone interested in making 4.32%

Looking for break out in 41504150 stock has formed two valleys, and I believe if it brook the resistance line at 14 SAR . if does break and bounce back. it will be an entry signal.
If this happens, I think it's better if we set stop-loss at 13.7 and partial take profit at 15.6
