Buy Trade Plan — National Agricultural Development Co. (6010)Yes in the daily timeframe here, a Dealing Range (DR) is clearly formed.
Price created a recent swing low, then pushed up, broke short-term structure, and is now consolidating just above that breakout point. This DR acts as your context area for the bullish continuation toward the previous swing high around 28+.
So in simple terms:
HTF Bias: Bullish
Daily DR: Formed and holding
6010 trade ideas

Long for Nadec The chart is bullish if we don’t close below 27. With possibility for new all time highs.
Disclaimer:
This is not a call to buy the stock

Different PatternsRecently made HH HL on Bigger TF.
Breakout Re-test possible around 21.50 - 22
Otherwise, Trendline Support around 24.80 - 26
Upside Targets can be around 28.50 - 29 & then 31+

Gann Analysis for NATIONAL AGRICULTURAL DEVELOPMENT Co. (TADAWUL1️⃣ Key Gann Levels Identified
The Gann levels shown in the chart act as support and resistance zones, where price movement often reacts. Below are the key levels:
Degree Price Level (SAR) Significance
720° 41.654 Major Resistance
630° 35.45 Strong Resistance
540° 29.746 Medium Resistance
450° 24.542 Current Level - Pivot Point
360° 19.838 Key Support
270° 15.634 Medium Support
180° 11.93 Strong Support
90° 8.726 Major Support
0° 6.022 Long-Term Base
2️⃣ Market Structure Analysis
✅ Recent Price Action:
The stock previously rallied strongly to 630° (35.45 SAR) but failed to sustain above it.
It has now retraced to 450° (24.542 SAR), which is a critical pivot level.
Price is trading near a support zone, making this an important level to watch.
3️⃣ Possible Future Scenarios
📈 Bullish Scenario (Price Moves Up)
🔹 If price holds above 450° (24.542 SAR) and forms a bullish structure:
✅ First target = 540° (29.746 SAR)
✅ Next target = 630° (35.45 SAR)
✅ Final bullish target = 720° (41.654 SAR)
🎯 Confirmation for bullish move:
Price closing above 540° (29.746 SAR) with strong volume.
RSI/MACD showing bullish divergence.
📉 Bearish Scenario (Price Drops)
🔻 If price breaks below 450° (24.542 SAR):
❌ Next support = 360° (19.838 SAR)
❌ Deeper support = 270° (15.634 SAR)
❌ Final major support = 180° (11.93 SAR)
⚠️ Warning Signs for a Bearish Move:
Weekly candle closes below 450° (24.542 SAR) with high volume.
Momentum indicators (RSI/MACD) turn negative.
4️⃣ Recommended Trading Strategy
✅ Long (Buy) Setup:
Buy near 450° (24.542 SAR) with stop-loss at 23.50 SAR.
Target = 540° (29.746 SAR) → 630° (35.45 SAR)
❌ Short (Sell) Setup:
If price breaks below 450°, short with target at 360° (19.838 SAR).
Stop-loss = 26 SAR (above recent highs).
Final Notes
⭐ 450° (24.542 SAR) is a key decision point.
⭐ Holding above it = bullish; breaking below it = bearish continuation.
⭐ Monitor price action & volume for confirmation.
you can request analysis for any stock
just write in comments,
wish you best of luck!

National Agriculture Company 6010
## **Trading Plan: National Agriculture Company**
#### **Concept**: SMC (Smart Money Concepts)
**Key Focus**: Perplution Order Block + Break of Structure (BOS)
---
#### **Market Context**:
1. **Daily/4H Analysis**:
- Identify a bullish/bearish **market structure**.
- Look for the **last valid order block** before the impulse move.
2. **Current Observation**:
- Price is approaching a **Perplution Order Block** (POB).
- Waiting for confirmation of a **Break of Structure (BOS)** to validate the bias.
---
#### **Entry Plan**:
1. **Buy Setup**:
- Wait for price to **break structure upward**.
- Enter on the **retest of the POB** with a valid bullish candle confirmation.
- Use Fibonacci for additional confluence (61.8%–78.6% retracement zone).
---
#### **Risk Management**:
- **Stop Loss**:
- Below the **Order Block's low** or last swing low.
- **Take Profit**:
- First target at the **next liquidity zone** (equal highs or FVG).
- Final target at the **premium range** of the market structure.

6010 NADECHello traders,
The National Agricultural Development Company (NADEC) is one of the clear companies in Saudi market.
Now: 29
with stop loss: 28
and the next target is 32.6 SAR.
Good luck for all

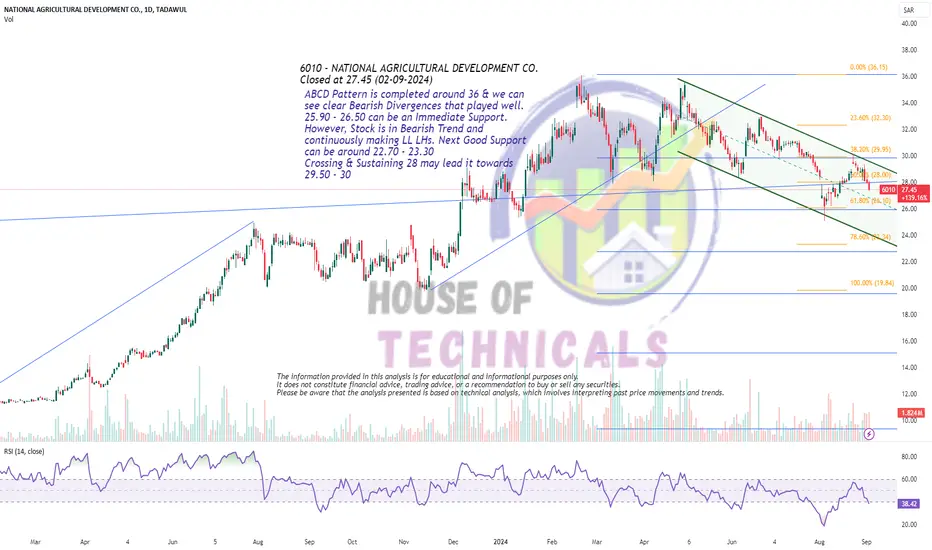
ABCD Pattern is completed around 36ABCD Pattern is completed around 36 & we can
see clear Bearish Divergences that played well.
25.90 - 26.50 can be an Immediate Support.
However, Stock is in Bearish Trend and
continuously making LL LHs. Next Good Support
can be around 22.70 - 23.30
Crossing & Sustaining 28 may lead it towards
29.50 - 30
LL on Daily TFTo Continue the Bullish Trend,
it should cross & sustained 36.10; the target
would then be around 44 - 45.
Recently, it made a LL on Daily TF.
Now 32.60 - 33 should be Sustained, otherwise
the price will move further down towards
29.80

Bullish on Bigger Time Frames
However, Bearish Divergence is also
Observed on Weekly TF
ABCD pattern completes around 35 - 36 along-with
bearish divergence makes this level bit shaky at the
moment for new entrants.
32 - 33 Levels may act as Support but we Need
some Confirmation there.
However, Crossing & Sustain 36 would move it
Further Up; may be up to 39 initially & then 44 - 45

6010| NATIONAL AGRICULTURAL DEVELOPNATIONAL AGRICULTURAL DEVELOP
Nadec
New ATH!
Next targets at 40> 55> 70>90>105 SR(250%)
Good luck!
Please dont forget to boost, comment and like!

NADEC has shown weakness and formed a top H&Ss NADEC has just formed a top H&Ss though its neckline is slightly up-slanted which some chartists don't take for consideration. It still follows most of the formation principles such as the spike in volume corresponding head and the shoulders. To sum up my readings which could be wrong sometimes.
weaknesses:
1- parabolic move is broken down! see the arrow in chart
2- Within the major H&Ss formation, a minor "right angle triangle" is formed which in many cases is bearish considering the decreasing heights.
3- Corrective Wave III is on the run and it is usually very very aggressive.
strength:
1. Fundamentally, the company has improved its net-profit.
2. Corrective wave C is formed and either it goes on or revers but usually the latter.
I don't mean to bore you with my analysis, but if you want to short it, wait till the yellow-highlighted support as seen in chart is broken down with some volume then you get the confirmation.


