ELM (TADAWUL: 7203) - Double Bottom Breakout SetupThe price action on the 4-hour chart of ELM CO (TADAWUL) has formed a double bottom pattern, signaling a potential bullish reversal.
Trade Idea:
A breakout above 1115.0 confirms the double bottom pattern.
Risk management is crucial – placing SL below bottom at 1048 to ensures controlled risk.
Key Levels:
Neckline Breakout: 1115.0 (Entry Point)
TP1: 1182.0
TP2: 1249.0
Stop Loss : 1048
7203 trade ideas

Elm (TADAWUL: 7203) – Key Gann Levels in Play!Elm has been on a rollercoaster ride, experiencing a strong uptrend before hitting resistance and pulling back. The stock is now trading around 1,059 SAR, testing a key 360° Gann level at 1,015 SAR. So, what’s next? Let’s dive in!
Could be the scenario ;)
🔍 Technical Breakdown:
🔹 Resistance Levels:
1,181 SAR (405° Gann level) – A key zone that previously acted as resistance.
1,359 SAR (450° Gann level) – Breaking above this could restart the bullish trend.
🔹 Support Zones:
1,015 SAR (360° Gann level) – Crucial support currently being tested. A hold here could trigger a bounce.
862 SAR (315° Gann level) – Next potential support if selling pressure continues.
🔹 Trend Analysis:
The stock had a massive bull run before topping out and now seems to be in a correction phase.
If bulls defend 1,015 SAR, we might see another upside attempt.
🎯 Potential Scenarios:
🟢 Bullish Case:
Holding 1,015 SAR could lead to a retest of 1,181 SAR and, if momentum continues, a push towards 1,359 SAR.
🔴 Bearish Case:
A break below 1,015 SAR could signal further downside towards 862 SAR and possibly lower.
⚠️ Key Takeaway:
Elm is at a make-or-break level! Will bulls step in at 1,015 SAR, or is more downside ahead?
💬 What’s your outlook? Share your thoughts in the comments! 🔽🔥
#Elm #TADAWUL #StockMarket #GannAnalysis #TechnicalAnalysis

Long SetupCup & Handle Formation along with Ascending Triangle.
Good to Buy at Mentioned Entry Point.

Elm Stock Warning for BuyersElm Stock Warning for Buyers
Reason: No new FVGs, indicating reduced bullish momentum.
Warning: Buyers should be cautious as the price nears mitigated FVGs or Supply Zones.
Action: Avoid new entries until clear confirmation of demand resurgence or breakout above key levels.
Observation: Watch for bearish rejection or price consolidation as signals of a potential reversal.
Stay alert to price action and avoid overexposure.

Though Still Bullish but ...Though Still Bullish but there is a
Bearish Divergence on Monthly as well
as Weekly Time Frame; so one should stay
Cautious.
To remain Bullsih, it should Cross & Sustain
1190 - 1193. & if this level is Sustained, we
may witness 1380 - 1400+.
On the flip side, if 1000 is broken, we may see
Trend Reversal.

7203: Strong SupportELM has been in correction for a while.
Bullish trend has started in recent past (Parallel Channel breakout).
Price is in consolidation at a strong support level.
Entry can be taken now with
Conservative SL or Aggressive SL
Manage your risk and trail SL

7203The price is currently testing 200 day EMA with the closing price of 842.4 in the last trading session. Moving forward, if this level sustains then a possible pull back can be seen in its price with the initial resistance lies around 954 and secondary resistance level lies around 1,003. Use stop loss at 815 just below the recent low.

7203The price action is in uptrend making higher highs and higher lows and currently pulls back from 100 day EMA and currently testing 50 day EMA and closes at 942 in the last trading session. Initial resistance lies around 1,000 and secondary resistance lies around 1,120, upon breaching these levels the stock has potential to make more higher highs. Use stop loss below 910 to manage risk.

Bearish Divergence on Weekly TF
890 - 900 may act as a Good Support
Stoploss should be below 890 on
closing basis
Targeting around 930 - 950

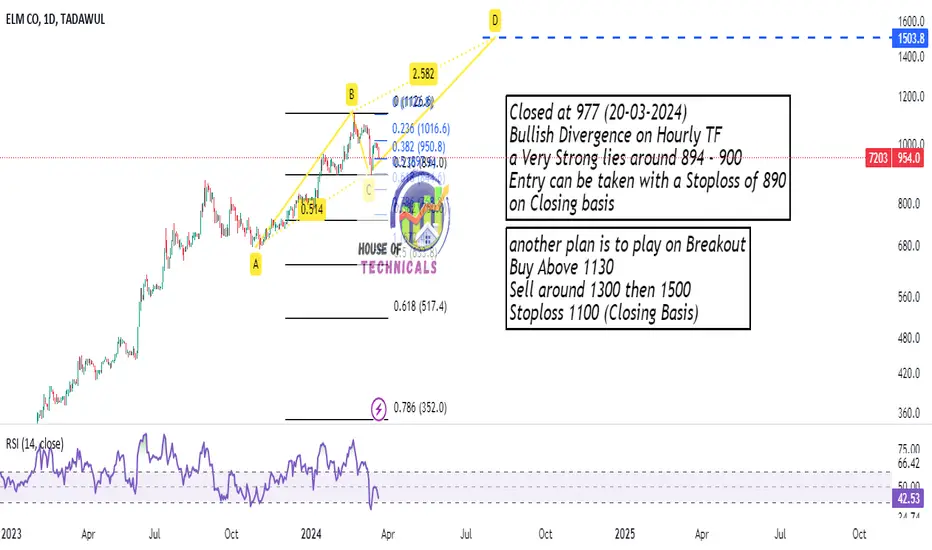
Should wait for Breakout?Closed at 977 (20-03-2024)
Bullish Divergence on Hourly TF
a Very Strong lies around 894 - 900
Entry can be taken with a Stoploss of 890
on Closing basis
ELM COthese arrows indicat that the ELM CO
is trying to swip out more buyers before continuing
the long trend

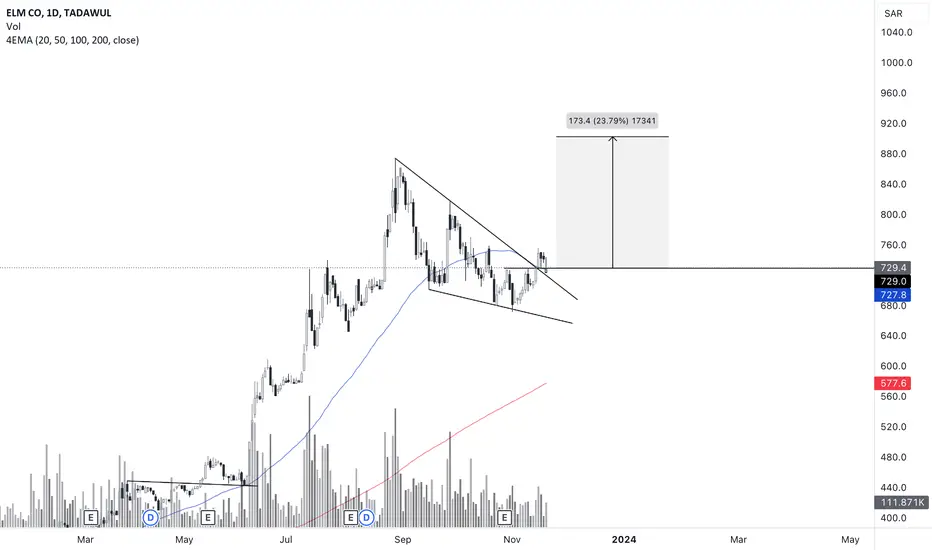
Falling wedgeFalling wedge in up trend , increase in volume , retest done and moving average 50 support .
7203_Breakout (Bullish)7203 has been in bearish trend (correction) for a while after making All Time High.
Formation of LL, LH respecting a descending trendline resistance (Triangle Top)
Recently has made a double Bottom confluenced with Golden Pocket, Good Support Level.
Breakout of Descending Trendline is observed for first time in a while.
After retest, trendline is respected (acting as support).
Long position above horizontal resistance line can be taken (confirmation after formation of HH)
Bullish trend will be confirmed after formation of HL
Trade with SL


ELM | 7203 | #TASIThat's a good candle for today, in my opinion, it's good to buy today and tomorrow unless the bar shape is change.
Don't be rush. TADAWUL:7203
STOP LOSS IS CLOSING BELOW 740.


ELM forcastingThis idea is posted for prediction according to Gann Science.
The times are clear, the goals are clear, a condition for the success of this analysis is not to break and close below the channel for two consecutive days.


7203: ELM (Potential Bullish Setup)ELM is moving in consolidation phase for quite some time.
Price is in upward trend on higher time frame.
Watch for channel breakout
Trade with proper stop loss

ELM short future planAccording to the chart ELM is going to hit the up trend soon or may be not ..
Buy or sell up to you

ELM Co. | 7203 | Series of HH & HLA series of Higher highs (HH) and Higher lows (HL) is formed on the chart which shows an uptrend is in play.

7203:TASIRespecting Trendline Support
Bullish Trend with series of HH and HL
Possible Breakout of Symmetrical Triangle
Enjoy the ride with trailing stop loss
