TasiContinuation of decline untill reaching Fibonacci lvl.0 then highly probabl reversal for higher targets ( including Fibo lvl.1 )
This is for educational & entertainment purposes only and not a financial advise.
TASI trade ideas

TASI time to sellwe will see a continuation of the downtrend after we have seen a break in the trend line and a correction at the level of the trend and and double bottom

Tasi please let me know Hehehehheheehe
91
91
3003 is an excellent source of information on the world and for all of the best interests in the industry and is a great resource to the most important part of our 60 business that in our lives that we need

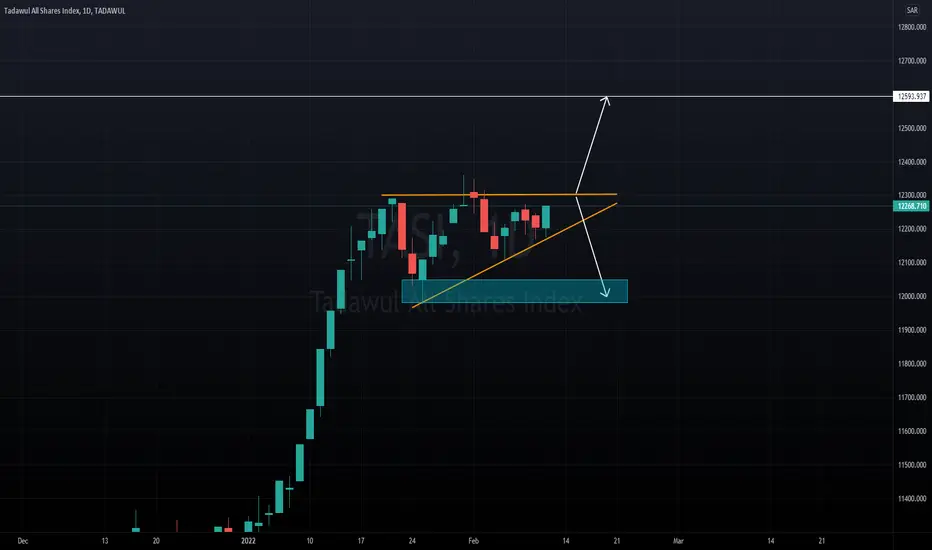
TASI time to buyafter the downtrend that we had we will see a big movement of an uptrend we can take the buy position after the confirmation of the range breakout

Tasi midrange look supports and resistanceSupport has been broken next support 11550
Lower uptrend line hopefully soon trading above


Tasi Last chance for TASI to be in (up trend)>>>>>
be careful making any trad before testing the demand area


Bullish as usualSaudi Stock Market is very bullish and in a strong uptrend 12600 is a resistance zone and i think market will break that and make a new high. Next target is 12800 for now.

TASITASI: the index is about to complete the zigzag correction before continuing it is original trend to the downside.
the invalidation level for this count is 11956 levels
Alternative count: the impulsive down wave to be counted as WXY, while the current correction remains as a Zigzag ABC, in this case the index might slightly break the 11956 then fall back again to complete the correction to the downside.

Big cap companies for TASII suspect that TASI will make new Highs in the next weeks, leaded by Alrahji bank. However, most of TASI companies are making new lows and are going to do the same.
The final target is around 12500-12700, Heavy correction is going to follow

Bullish PatternMarket is again turning bullish if this wedge breaks to the upside we can expect it to touch 12600 levels at the same time lets prepare negative side as well if it breaks to the downside we can see a retest of 12000 levels too. Over all looking very bullish !
Hit like & follow guys ;)
TASI SHORT Hello traders, today I want to talk with you about TASI index.
i prospect a downward trend ON TASI, what is the reason:
-we have two bearish patterns.
-we have AO bearish divergence.
-price touched a STRONG RESISTANCE ZONE that respected many times.
-price touched 0.5 fibo level .
-we have decrease in buyers momentum.
thank you for watching the analysis, it will be great when you support it with a like, follow me for more market analysis .

Tasi Towards a decline of -5% with a high probability!Hello ladies and gentlemen, according to my graphical analysis of The TASI Index, there is a high probability of a decline towards the 11800 level in the next few months inshallah.

Simple BUT Not EasyReading charts and understanding the "Language" of the market is very simple but at times due to high involvement of our emotions we make it very hard.
Any market or chart that you see will be in a phase all you have to do is identify it on a higher time frame.
Lower Lows & Lowers Highs is a definition of a down trend.
Higher Highs & Higher Lows is a definition of a up trend.
If you can see the above both happening then market is ranging.
If you are having a short bias on a particular instrument always look for a shorting opportunities in a lower time frame after confirming the phase of the market in a higher time frame.
Always wait for a confirmed trend don't try and jump in too early.
Let market decide the direction, don't force your self.
Risk Management is very important, Plan your trade with a proper risk that you can manage.
Trading is a marathon, if you try to sprint you will fall down and injure yourself.
Slow & steady wins the game :)
Thanks

TASI Short Term Goal TASI will most likely fall to 11,400 points for the following reasons:
1- The stock markets around the world are trending downward
2- The technical indicators and analysis indicates that TASI will most likely start trending down
3- There are many other reasons for my reasoning, but I do not have the time to write them down.
Regards,

Correction TimeThere is no doubt that TASI is in a strong bull trend but we also know that market cannot just keep moving in 1 direction there is always a correction phase. Market as of now is over heated and need some healthy correction I think it will respect the support which coincides with the long term trendline. Overall surely TASI is a bullish market!!
Hit like & follow guys ;)
