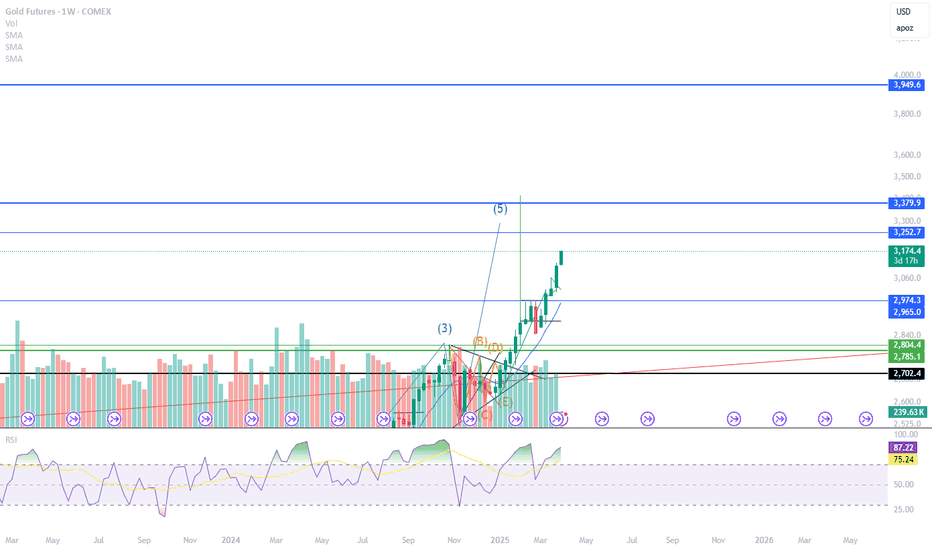
Hilarious algo failImagine getting one hour to think about what to do after the Trump speech, and coming up with the idea to sell your only winner (gold futures) at market price immediately after the one hour break, lol. Probably sold it to buy more index futures, lol, morons.
Apparent that is what at least one of the algos did. It looks like all of the algos are desperate for cash right now because gold futures are not tracking spot price. (I posted a plot)
If you bought GLD like I did, look at spot pricing XAU/USD tomorrow, not futures GC1!. We're up over 1% now.
GDF1! trade ideas
Long trade
Pair GC1!
Buyside trade
NY Session PM
Thu 3rd April 25
7.00 pm approx.
Entry 3175.7
Profit level 3196.6 (0.66%)
Stop level 3173.6 (0.07%) RR 9.95
Reason: Observing price action on the 1min TF seemed indicative of a buyside trade based on the narrative of of demand and demand for directional bias. Entry 1min TF
1min TF overview
Can Gold Continue Higher? Last month, I pointed out that Large Speculators started to close out their net-long positions in Gold futures, betting on the possibility of a reversal as they attempted to time the market turn at all-time highs. This behavior continued for several weeks, yet Gold’s price continued its upward rally, leaving many traders scratching their heads. What’s particularly puzzling is the lack of chasing in this rally, especially considering the massive price movement since then. This is particularly surprising because Large Speculators, for the most part, are trend-followers — and right now, the trend in Gold is unmistakably bullish.
When comparing positioning in Gold to Silver, there’s a distinct difference. While Large Speculators initially followed the rally in Silver, continuing to buy as Silver lagged behind Gold, this strategy was much more reactive. Silver’s underperformance relative to Gold made sense, given that Silver is more crowded than Gold — meaning there’s less demand and fewer buyers.
The key takeaway from this analysis is that the Commitment of Traders (COT) report can offer valuable insights into which market presents the better risk/reward trade. In this case, the COT report highlighted Gold as the superior trend to follow, especially for traders looking to capitalize on precious metals amidst all the tariff news and rising market uncertainty. By using the COT, traders can refine their strategies to focus on trends with more significant potential, rather than getting distracted by more volatile, crowded trades.
Year ahead 25' GoldGOLD Analysis
The uptrend channel remains intact, with price currently trading near the uptrend line. I’ll shift to lower timeframes to explore intraday opportunities.
Always consider all potential price movements and prioritize trades with the highest probability of success. Remember, patience and precision are essential for maintaining an edge in the markets.
INTRADAY MOVEMENT EXPECTEDi can see still there is liquidity above at the poc of the weekly volume
but if the price can cross up the level it can visit the next resistance above
so if the price at london session cross down the value area i will expect visit the levels shown on the chart as support and make the rejection
so we have to follow the plan and and use the levels on the chart risk management safe the profit secure the orders after the price move stop at break even
we wish happy trade for all
Gold running out of Gas to keep pushing up!I have been waiting for a solid pull back. Price looks like it wants to give it up. But since it is so bullish I have to wait for it to show its hand first before assuming. If price wants to continue with the strong bullish action I feel they need to come back and correct some of the price action first. Looking for signs they want to continue for Asian Session.
GOLD - New Week, New Month, New Quarter! = Opportunity Gold has not been moving how I feel it normally should. The last 2 weeks have been extremely bullish with no significant pullbacks. I believe they wanted to close last month completely bullish before they offer the solid pullback that we are looking for. Also this is a new quarter. Taking it easy as we come into this new quarter but keeping a eye on all the signs for direction.
Long for Gold: Seizing Safe-Haven Opportunities Next Week
-Key Insights: Gold is maintaining its robust uptrend as it benefits from global
economic uncertainties, making it a favored safe-haven asset. Investors are
moving towards gold due to geopolitical tensions and a volatile stock market.
The precious metal's performance is strong compared to other sectors, with a
bullish outlook supported by experts and analysts.
-Price Targets: For the upcoming week, traders should consider the following
targets and stop levels for long positions: T1 at 3155 and T2 at 3220,
indicating potential gains. Set your stop levels at S1 of 3080 and a more
conservative S2 of 3050 to mitigate risks.
-Recent Performance: Gold has showcased a strong and consistent uptrend,
distinguishing itself amidst broader market volatility. Its appeal as a safe-
haven asset has attracted investor interest, particularly as geopolitical
tensions and trade developments influence market dynamics.
-Expert Analysis: Analysts maintain a bullish perspective on gold's trajectory.
Despite warnings of possible corrections if certain resistance levels are met,
the overall sentiment is optimistic. Experts emphasize the strength of gold in
current economic conditions, underscoring its appeal.
-News Impact: Ongoing trade war developments and geopolitical tensions are
significantly impacting gold prices, reinforcing its position as a safe haven.
Investors are advised to stay informed about tariff changes and policy shifts,
which can influence demand and drive price momentum.
In conclusion, gold remains in a favorable position, driven by persistent
economic uncertainties and investor flights to safety. Targeting the specified
levels can optimize outcomes for those positioning long in the market next week.
GOLD - WEEKLY SUMMARY 24.3-28.3 / FORECAST🏆 GOLD – 5th week of the base cycle (15-20+ weeks). After a brief correction at the pivot forecast on March 19 (see the previous post), gold resumed its bullish trend at the extreme forecast on March 24 – the midpoint of retrograde Mercury.
⚠️ Holding the long position from the extreme forecast on March 3. The movement range to the pivot forecast on March 19 for GC futures exceeded USD12K per contract. Those who took profits, I hope you reopened long positions. The next extreme forecast for gold is April 7.
A Gold'en Newtonian Sell-Off Porjected By MedianlinesSir Isaac Newton stated the Third Law of Motion in his landmark work, Philosophiæ Naturalis Principia Mathematica (commonly called the Principia), which was first published in 1687. This law appears in Book I, in the section titled Axioms, or Laws of Motion.
(Axiom: A self-evident truth)
Newton did explicitly present it as an axiom. In fact, it's Axiom III (or Law III) of his three fundamental laws of motion. Here's how he phrased it in the original Latin and in his own English translation:
"To every action there is always opposed an equal reaction: or the mutual actions of two bodies upon each other are always equal, and directed to contrary parts."
And what does this have to do with Medianlines / pitchforks?
This tool measures exactly that: the action — and the potential reaction!
Medianline traders know that pitchforks project the most probable direction that a market will follow. And that direction is based on the previous action, which triggered a reaction and thus initiated the path the market has taken so far.
…a little reciprocal, isn’t it? ;-)
So how does this fit into the chart?
The white pitchfork shows the most probable direction. It also outlines the extreme zones — the upper and lower median lines — and in the middle, the centerline, the equilibrium.
We see an “undershoot,” meaning a slightly exaggerated sell-off in relation to the lower extreme (the lower median line). And now, as of today, we’re seeing this overreaction mirrored exactly at the upper median line!
Question:
What happened after the lower “overshoot”?
New Question:
What do you think will happen now, after the market has overshot the upper median line?
100% guaranteed?
Nope!
But the probability is extremely high!
And that’s all we have when it comes to “predicting” in trading — probabilities.
Why? Because we can’t see the future, can we?
Gold?
Short!
Looking forward to constructive comments and input from you all
Gold ExpansionCOMEX:GC1! reversed off the weekly average zone and is gradually working through that 4H FVG.
Looking for a clean break above it, then a retrace back to that zone. My target is the Daily Major Buyside Liquidity, with an eye on a potential extension toward the Weekly Average Expansion area if momentum holds.
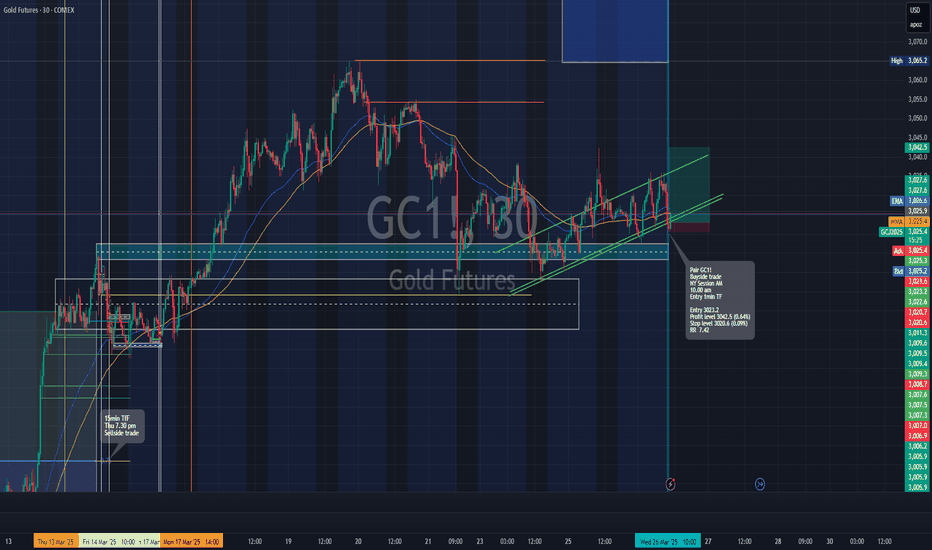
Be the Choosy trader on Gold!Price is dragging on dropping. being very indecisive. Looks like the entire market is waiting on News to help give it a push. I need to see price break out of value before I can get a read on a sold move. in the mean time this is sclaping conditions. You can hold trades. Have to cut them short quick with this price action. Since we have some USD news tomorrow that indicates that the market might be waiting for that before proceeding on any decisions. Patience is key!
Long trade
30min TF overview
1min TF Entry
Pair GC1!
Buyside trade
NY Session AM
10.00 am
Entry 3023.2
Profit level 3042.5 (0.64%)
Stop level 3020.6 (0.09%)
RR 7.42
Reason: Looking left at previous price action and respected levels along with the Periodic Volume Profile (PVP) indicator and ascending channel seemed to suggest we were at a prime demand level indicative of a buyside trade.


