Dow Jones Retreating To Bottom Of Range Looking For Support 38KI see the start of a down move over the course of the next 6-8 weeks to drift down to the bottom of the range in order to achieve a couple of objectives.
1. Fill the Gap from January 19th
2. Hit all the stops from Longs along the way
3. Hit the 1X range expansion of the High/Low from Feb 23rd- Mar 5th
I am bullish over the next decade but right now it looks like a 4% decline is necessary for the consolidation before we start heading higher into the 40,000s
It will give the monthly 21ema a chance to catch up and the bottom low will be a bounce off the monthly 21ema
My ultimate price target is 115,000 in 2035
UDF1! trade ideas

YM Range Bound Mean Reversion StrategiesI have been getting my behind kicked the last two months due to this range bound market.
Something that I just now noticed is that on the hourly, the 21ema (purple line) is the same exact average as the 5 minute's 200sma. They are one and the same.
Since price is not respecting the hourly's 21ema, then logically, it will not respect the 5 minute's 200sma and henceforth price will oscillate back and forth around that mean price.
The 2 minute chart's 525 period moving average is the one and same of both the 5 minute's 200sma and the hourly's 21ema. All three are the same exact moving average and price always finds its way back to it.
There have been great mean reversion trades back to the hourly 21ema that I have been missing because I have been employing trend following systems to this market and failing.
Each one of these great mean reversion day trades have been over 100 ticks on the Dow

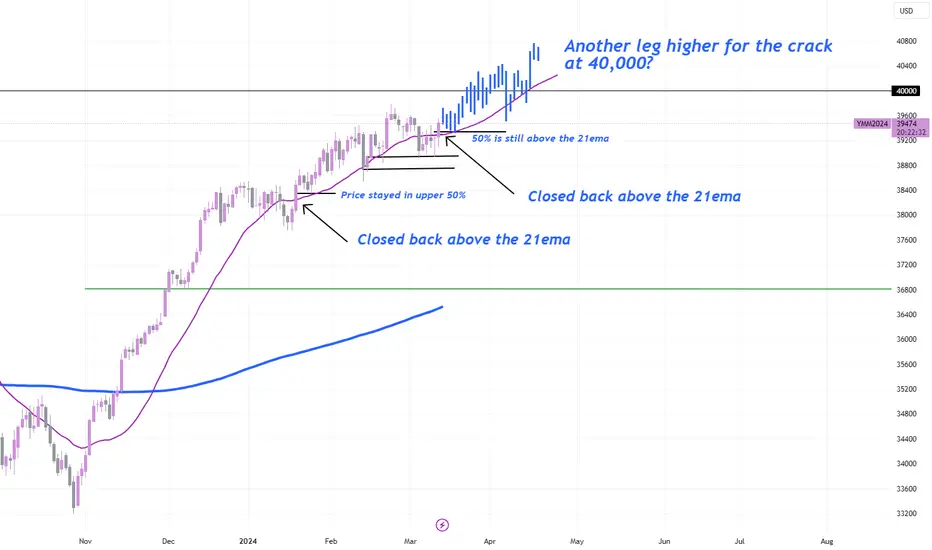
YM Dow Jones another leg up for 40kJust like January 19th how price closed above the 21ema after a couple of down/sideways days, it went on to continue the bull trend.
Today did the same thing. Closed above the 21 after a couple of down/sideways days.
After placing a trendline at the exact 50% mark of today, I believe price should stay above it and the 21ema IF the bullish trend is to continue.
The obvious target that is screaming at me is the 40,000
Indices:🔴Is it the major market structure shift?🔴
Well As you can see, we can see the SMT here so we can expect a downtrend.
The first condition is, that we see the price close the candle body below the bullish FVG, only then can we expect the price to go lower to collect the sell-side liquidity.
After that, If the first condition occurs, we need the candle closure below the sell side liquidity, then the price activates the bearish breaker block and the breaker can act as a strong resistance and pull the price down.
💡Wait for the update!
🗓️10/03/2024
🔎 DYOR
💌It is my honor to share your comments with me💌

YM Dow Jones Friday the 8th GameplanI see two gaps that need to be filled. Will they get filled? I don't know. I am leaning bullish. I can see the market bumping up against the 200sma one more time before falling down to fill the gap on the bottom. Then a bullish climb higher to fill the gap higher?
Or perhaps it doesn't fill the gap on the upside yet on Friday and will wait for Monday or Tuesday?
I will take it bar by bar and see what is in store.

YM 3 Day Pattern Set UpI found an interesting pattern that has happened 3 times so far.
A sell off day
A gap up and fill
A second gap up and fill. Sometimes doesn't fill, just continues bullish
First Pattern
Second Pattern
Third Pattern
This could mean nothing but it was something I felt sharing

Sell YM (DOW JONES FUTURES)Hello,
We have a fantastic signal to sell YM on 15min chart with a target of 38455$ in couple of hours,
Ibrouri

YM - Unruly Dow 30Unlike ES and NQ, YM has failed to create a higher high on the daily timeframe suggesting that if we were to see some form of a retracement, YM could be the first mover.
My philosophy is simple...
Fortify Michael J Huddlestone's concepts that I have studied to consistently predict where the market is more likely to go.
This includes;
- Market Structure
- Buyside/Sellside Liquidity
- Order Blocks
- Liquidity Voids
- Fair Value Gaps
- Optimal Trade Entry
- Premium/Discount Array
- SIBI/BISI
- Many More!
The strategies mentioned here are some of many that I use to implement into my analysis and over time, with consistency I aim to achieve a high degree of accuracy in the markets with the foresight and understanding to assess what went wrong when my bias is negated.
Credits;
- Michael Joe HUDDLESTONE
- Shawn Lee POWELL
- Toray KORTAN

YM Day Trading Gameplan For WeekNow that Monday has finished trading, I have a better idea of what is likely to happen.
Price is looking like it is in a 2 legged pullback to find the next higher low.
Price has been inside of a bear flag since the 27th
I will be looking for shorts on Tuesday and Wednesday down into major 1 hour support for a new higher low.
My stops are always 30-40 ticks with targets varying between 65-85 ticks
I trade in direction of the 15 minute higher timeframe with the 5 and 3 minute as entries.
If the bullish trend will continue, then it needs to find a higher low and then break higher to a higher high. I will be looking for 39,500 this week hopefully as the higher high

US30 BULL RODEOThis is my demand zones for US30, it has been a long time since I traded US 30, but it's looking very bullish! We have made some new highs and expect to keep pushing! The target could be 40000 in the longer term since that´s a round number and a psychological level.

YM - Sellside Rush @ All-Time Highs Apologies for the quality in this recording. My previous one deleted last minute and I never had time to create another detailed review before work.
Last week, we were looking out for shorts but never got the full range.
This time, 39,050 - 39,040 is in the cards for this weeks trading
My philosophy is simple...
Fortify Michael J Huddlestone's concepts that I have studied to consistently predict where the market is more likely to go.
This includes;
- Market Structure
- Buyside/Sellside Liquidity
- Order Blocks
- Liquidity Voids
- Fair Value Gaps
- Optimal Trade Entry
- Premium/Discount Array
- SIBI/BISI
- Many More!
The strategies mentioned here are some of many that I use to implement into my analysis and over time, with consistency I aim to achieve a high degree of accuracy in the markets with the foresight and understanding to assess what went wrong when my bias is negated.
Credits;
- Michael Joe HUDDLESTONE
- Shawn Lee POWELL
- Toray KORTAN

YM1! Either a Re-Accu or a Distro SchematicMarket is extremely bullish, and likely to try the 4000 USD psychological level to attract more buyers. In any case, we need to see the H1 schematic to play out, and in this case, wait to see what happens in Phase C and D.

Dow Jones Target Of 40,000 Coming SoonJust following the bull trend of higher highs and higher lows.
Right now it looks like another consolidation near support and a higher low from Feb 21st
I think 40,000 is where the market wants to go and will just keep buying the dips.

Dow Jones in Focus: Fake Rally?Today, we're taking a closer look at the Dow Jones Index, specifically the E-Mini Dow Jones Futures. It appears we're in Wave (2), overshooting the target and forming an Expanded Flat correction. If there's a turnaround here, typical for such waves, we might see a correction somewhere between 50% and 61.8%. We consider more than 78.6% unlikely, so we're betting on a correction in the 50 to 61.8% range.
Digging deeper, we've spotted an exciting pattern: a short Wave (i), followed by a long Wave (ii), a quick Wave (iii), and a very brief Wave (iv). This sequence could lead us to either Wave (v) or a larger B wave. Should the index continue to climb, we'll need to rethink everything. Surpassing the $40,000 mark would mean we're entering a new uptrend, requiring a different analysis. For now, we're leaning more towards a downward movement than an upward one. After much consideration, we've decided to initiate a short position on the Dow Jones as a bit of a hedge. We're particularly cautious about unexpected market movements triggered by insider trades. This strategy isn't about putting all our eggs in one basket but about spreading our risk.
In short, this strategy is our insurance policy. If the market continues to rise, any loss on the short position would be offset by gains in our long trades. Conversely, if the market declines, the short trade will help minimize our losses. This balanced approach keeps us flexible and eager to see what unfolds.

YM Buy Set Up on Daily. Buy over 39,044Set up is pulling back to a rising daily 21ema, when green takes out red, buy limit. That would be 39,044.
The weekly 21ema is pointing straight up, indicating higher prices projected.
So far this week has been a slow and steady pullback, a resting bar.
Short term target is 40,000 minimum
Long term target is 115,000 in 2035
Demographics tells me that Millennials will become the biggest generation and they will be hitting the years 35-50 range ( Prime Earning and Saving/Investing Years)
This will drive up the bull run.

YM Pullback Looking For A Higher LowWith the weekly 21ema pointing straight up, I am looking for pullbacks for another higher low buy opportunity.
One range expansion of the 2022 high/low will put it at 45,000 as the bare minimum target.
I have a target area of 95,000-115,000 in the year 2035.
I believe price should stay above its rising quarterly 21ema for the remainder of the bull run higher to at least 115,000

Dow Jones Weekly Buy SignalAfter two weeks of consolidation at a rising weekly 21ema, last week's weekly candle broke and closed above both. I don't really see any pullbacks coming soon. First target is of course 40,000 but I plan on holding for awhile as I believe this move just got started. I can see 50,000 in the future as well.

YM - Weekly Rangebound Galore ?Massive spike out attempt on both buyside and sellside on the weekly timeframe. But in comparison to CME_MINI:ES1! and CME_MINI:NQ1! , CBOT_MINI:YM1! has been stagnant for the past two weeks.
Last week, I was expecting lower prices but the $38,100 manipulation that occurred was something that I thought would hold and we would see a candle body closure.
$38,000 is a region in price where I forecast CBOT_MINI:YM1! to trade to this week.
My philosophy is simple...
Fortify Michael J Huddlestone's concepts that I have studied to consistently predict where the market is more likely to go.
This includes;
- Market Structure
- Buyside/Sellside Liquidity
- Order Blocks
- Liquidity Voids
- Fair Value Gaps
- Optimal Trade Entry
- Premium/Discount Array
- SIBI/BISI
- Many More!
The strategies mentioned here are some of many that I use to implement into my analysis and over time, with consistency I aim to achieve a high degree of accuracy in the markets with the foresight and understanding to assess what went wrong when my bias is negated.
Credits;
- Michael Joe HUDDLESTONE
- Shawn Lee POWELL
- Toray KORTAN

YM Friday Gameplan Bullish/Range Bound Top of Rising WedgeToday closed at the end of the session with a bearish engulfment and a pin bar wicking into the top 50% of said engulfment. I am seeing the 21ema start to flatten out and possibly roll over with massive space between the 21ema and the 200sma.
Friday I think will be a choppy/range with a slight bullish tint to maybe take out Thursday's high and make another hit at the top of the rising wedge.
I will have to see tomorrow morning how price behaves. I am only making a rough guess as I tend to not like to have biases when day trading. I just trade setups.
Like today, I have a bearish long term position down to 24,000 or -37% but I still daytraded a bullish pullback setup
This was my only trade Thursday
I was wrong on the 0.85 fib but as I don't trade the first hour, I just sat and watched it plow right through it. I took the pullback trade a full 3 Hours and 50 Minutes after the NY open.
I have learned the hard way that me personally, I get destroyed in the first hour. It is like crossing the freeway and getting hit by a semi.

Angle of the 21ema and the strength of a Bull MoveJust experimenting with the angle of the 21ema and the likely move out of it.
I have seen about 4 different angles and 4 different bull moves
Strong Explosive Moves with 70-75 degrees
Decent Moves with 60-65 degrees
Grindy and choppy up moves with about 45 degrees
Most likely a pullback with 10-25 degrees

Dow Jones One Last Hurrah Into the 0.85 Fib Retracement 38,910Inside the daily rising wedge, price is making a final hurrah before it will roll over. I have marked with the blue line as the important 0.85 fib retracement level and I expect price to have difficulty around this area.
NY will open with a sizeable gap from yesterday and I believe it will be a range type day


Understanding Momentum to filter out the Best SetupsIn the video I discuss how I analyse momentum using MACDs and the 5min and 1min charts when daytrading.
Knowing these key concepts helps me filter out the best setups to get on the right side of the market and in the right trading zones.
The basic concepts discussed are :
- Momentum
- Price Action
- Candle Analysis
- Multi-timeframe Analysis
** If you like the content then take a look at the profile to get more ideas and learning material **
** Any Comments and likes are greatly appreciated **
