Another bullish flagI just jumped in here, DOW futures. Another bullish flag ready to break out to test the 3600 zone. You can buy calls too but would to wait until session opens.
Look how the price is pushing the flag resistance, I think is going to break at any moment.
UDF1! trade ideas

#DowJones #US30 #Action Areas For The Week AheadIn the is update we review the recent price action in the emini DowJones action areas and price objectives for the week ahead
•Past performance not indicative of future results

The Great Depression of the 2000's?Nearly a century ago, financial markets around the globe experienced a cataclysmic drop, the infamous Great Depression. Today, as we stand on the precipice of economic uncertainty, I can't help but draw parallels between the cyclical patterns of yesteryears and our current economic landscape.
Despite rising interest rates, the Consumer Price Index (CPI) remains stubbornly high, ushering in an era of stagflation. The lavish use of the FDIC fund to bolster banks like SVB has only fanned the flames of inflation, and its repercussions are palpable among the masses.
But here's where the plot thickens: Fitch, in a move that sent ripples across the financial world, downgraded the U.S. sovereign rating from the coveted AAA to AA+. While the markets might have taken this in stride, the implications are far from trivial. This isn't just about numbers on a spreadsheet; it's about the very reputation of the U.S. on the global stage. The last time we saw such a downgrade, in 2011 by S&P, the aftershocks were felt far and wide.
The reasons cited by Fitch, notably the "deterioration" of the country's finances and the "erosion of governance," are not revelations but rather confirmations of what many have whispered in hushed tones. The political chasm that has been widening for years now seems to have finally caught the eye of rating agencies. Yet, amidst this turmoil, the U.S. dollar stands tall, a beacon of hope in turbulent waters, still regarded as the world's premier reserve currency.
However, the real concern lies not in the immediate aftermath but in the long-term ramifications. The downgrade, while not a death knell, is a stark reminder of the fiscal challenges the U.S. faces, from funding Social Security and Medicare to bridging its ever-widening political divides.
A potential trigger for a decline in the Dow could be everyday individuals feeling the pinch, retiring early, or tapping into their 401(k)s to navigate the rising costs of living. The advent of advanced technologies, like GPT, has only exacerbated the turnover rates for workers in their 50s and 60s. I foresee a trend where these workers might opt for early 401(k) withdrawals or early retirement, further straining the economy.
In this tempest of economic uncertainty, I predict the following for the Dow: Target 1: 34,000, Target 2: 31,500, Target 3: 21,300. As we navigate these uncharted waters, it's crucial to remember that while history often rhymes, it doesn't always repeat.
ECONOMICS:USCCPI FRED:DJIA TVC:DJI

DOW update 2= if low break,Dow will go down very low size = put sellstop in last low possible and wait for buy above green arrow(filo 61%)
I belive main trend going to 38000 so be careful from sell, ,,,if you have old sells,you must hedge them near green arrow
good luck,wish you pick profit

#DowJones #US30 Action Areas For The Week AheadIn this update we review the recent price action in the emini DowJones and identify potential action areas and price objectives for the week ahead
•Past performance not indicative of future results

Dow 4hour say = near Fino 61 pick buy Frist wait buy pinbar comes then buy
strongly advice don't pick sell ,Dow can go to 38000
good luck

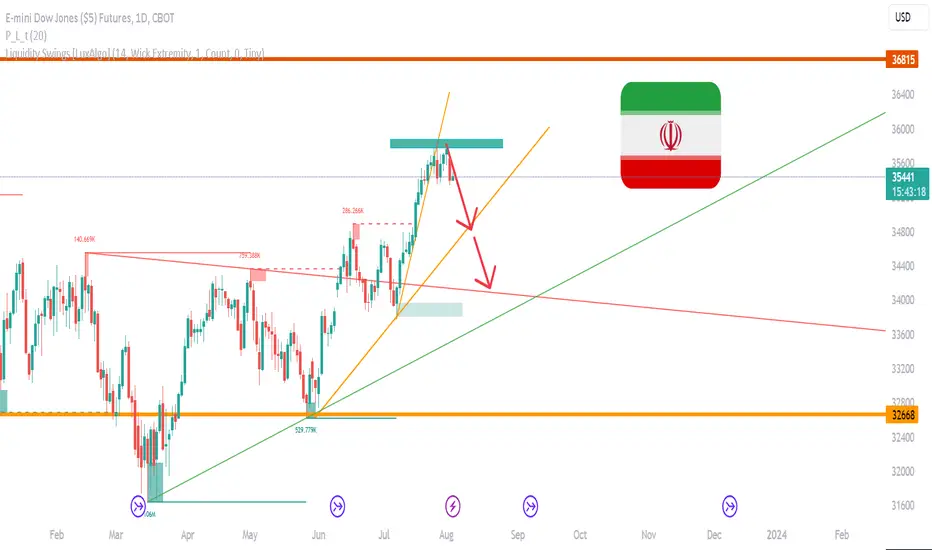
E-Mini Dow Jones SHORTThis is my analysis and prediction for the upcoming week ahead. The chart looked bearish on mid-term while still in a bullish mood in the bigger picture. The support zone will be tested and for now it is time to go short.


The start of the Dow Jones crashIt is very likely that the Dow Jones correction started from this position
#DowJones #US30 Action Areas For The Week AheadIn this update we review the recent price action in the emini Dow Jones and identify action areas for the week ahead and price objectives to target
•Past performance not indicative of future results

Dow Futures (YM) Ending Short Term Impulse SoonShort Term Elliott Wave view in Dow Futures (YM) suggests cycle from 7.10.2023 low is about to end as 5 waves impulse. From 7.10.2023 low, wave i ended at 34211 and dips in wave ii ended at 34060. The Index rallies again in wave iii towards 34493 and pullback in wave iv ended at 34410. Final leg wave v ended at 34792 which completed wave (i). Index then pullback in wave (ii) which ended at 34493. Index then resumes higher again in wave (iii).
Up from wave (ii), wave i ended at 34788 and pullback in wave ii ended at 34581. Index then resumes higher in wave iii to 35417 and pullback in wave iv ended at 35192. Final leg wave v ended at 35549 which completed wave (iii). Pullback in wave (iv) ended at 35348 with internal subdivision as a double three. Down from wave (iii), wave w ended at 35364, wave x ended at 35514, and wave y ended at 35348 which completed wave (iv). The Index resumes higher in wave (v) with internal subdivision as a 5 waves. Near term, as far as pivot at 34493 low stays intact, the Index can extend higher a few more highs before ending wave (v) of ((iii)). This should complete cycle from 7.10.2023 low and Index should then see larger degree pullback to correct that cycle.

E-Mini Dow Jones (LONG)E-mini Dow Jones looking good to long right now because the trend currently bullish. The risk reward 2:1 also is a good reward and this is a good trade.

#DowJones #US30 Action Areas For The week AheadIn this update we review the recent price action in the emini DowJones futures contract and identify the next high probability trading opportunity and price objectives to target
•Past performance not indicative of future results

Technical analysis: #DJI #Long positionAccording to the chart pattern, it looks like it will reach potential target at 38210.

#DowJOnes #US30 Action Areas For The Trading Week AheadIn this update we review the recent price action in the emini DowJones futures contract and identify some high probability action areas for the trading week ahead
•Past performance not indicative of future results

US30Je suis haussier sur le US 30. Un OB qui a très bien réagi. Donc, je le vois chercher la liquidité qui est à la hausse

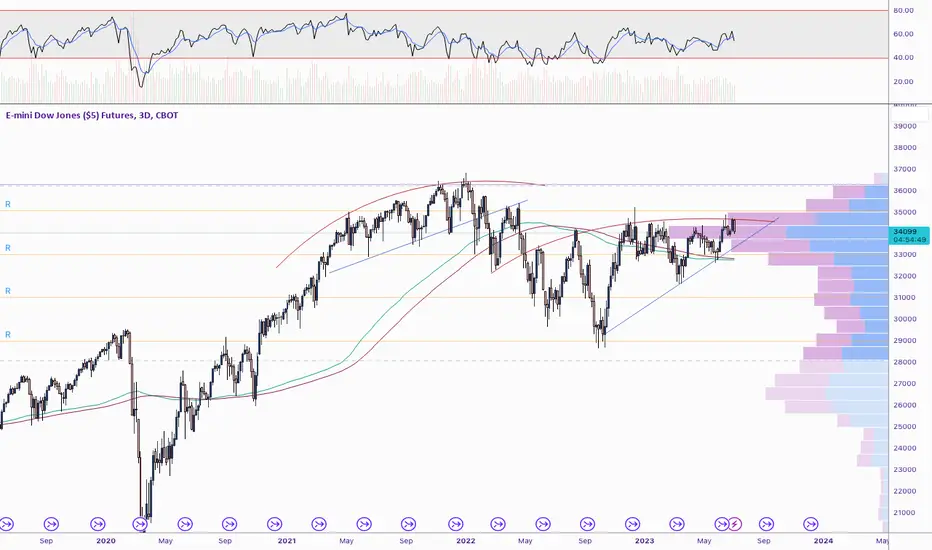
Dow Jones Futures; YM1! – 2H 2023, 3d chartPosting this to track the progress in the Dow Jones futures.
Currently forming a rounded top, expecting it to behave like a rising wedge. If you expect this to go bearish, don't be surprised if we get an overthrow before it breaks down. If it does breakdown, this forms a perfect double top.
If this breaks out and sustains the breakout, look to the following time periods for similar price action:
Q2-Q3 2018, or,
First half 2019
#DowJones #US30 Action Areas For The Trading Week AheadIn this update we review the recent price action in the emini DowJones futures contract and identify high probability action areas for the trading week ahead and price objectives to target
*Past performance not indicative of future results

Bearish Fractal: Dow Jones vs BitcoinThroughout the world, we see patterns arising. To some, they may seem like nonsense, but to others, there are certain formations that at times can be warnings of what's to come, as seen in this comparison. Bitcoin and the Dow are starting to match up in wave formation patterns, with Bitcoin being the leading indicator for future moves in the Dow. While this all may seem like pseudoscience, in actuality, what we are seeing is the movement of large players, shuffling billions around via dark markets and hedge funds. If this pattern continues, we should be seeing a major drop in the indices in July. TVC:DJI CBOT_MINI:YM1! BITSTAMP:BTCUSD

YM Long- Trades taken using confirmation entires have a higher probability for sucess.
- Using an initial 1:1 target is recommended for reducing risk.
- Short-term income trade ideas are good for the day unless otherwise stated.
*** For educational purposes only ***

Dow 4hour =buy pinbar on daily chartAlert=Fino 161% on weekly chart show upper target is 38500 , so be careful from sell
for now if last low not break ,it will go up , so buystopon last high is good idea (sl=low)
if you have old sell, 100% put hedge buystop in last high,,,brak it mean uptrend will story
goodluck

Dow Jones: Breather 😮💨Dow Jones is taking a breather near the resistance at 34 363 points, showing (again) a distinct response to this mark. Soon, though, the index should resume the ascent to develop the top of wave (i) in blue, which should then initiate a prominent downward movement. However, there is a 30% chance that Dow Jones could drop below the support at 32 246 points, plunging into the orange zone between 31 675 and 29 939 points to already expand wave alt.(ii) in blue. From this low, the index would then start a fresh upward movement.

Long MYMLong MYM. Rejection of London lows. Liquidity levels above to which it can draw to. Strong 15min bullish candle close above previous high.
