Dow Jones (US30) Big CrashUS Market Big Crash ! Will see you at 25600
By NDS (Nodal Displacement Sequencing)
UDF1! trade ideas

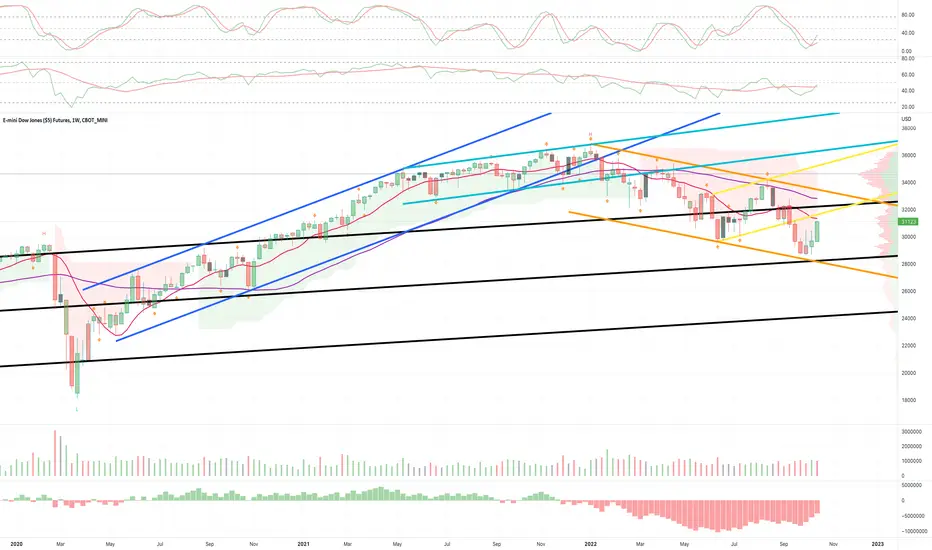
YM1! - Weekly Market Update, 10/31Dow Futures closed a hair above it's 200 day SMA and approaching KEY overhead resistance currently located @ 33,350 this past week.
Price either needs to push higher in order to break the down trend or fall here to continue the bear market.

DOW 4HOUR: we can sell now as predict 3days ago dow touch fibo 61 it is so clear dow dax and many index have sell now but daily chart trend can go to 35000
if you have old sell you must close above 31250
good luck


E-MINI DOW JONES ($5) FUTURESSupport and resistance of this symbol ( E-MINI DOW JONES ($5) FUTURES ) is shown
Dow 4 hour : 3 best place for sell after pinbar comesas predict 1week ago in low ,dow reach 31500 area ,,, in next 3 month it can reach 35000
alert: BE CAREFUL FROM SELL, DOW CAN FLYUP WILD AND DONT ALLOW YOU CLOSE SELL SO PUT SL
if you have old sells close or hedge them above 31000
wish you win

Dow Jones Futures: Close to front cloud chart resistance zone!Dow Jones Futures: Close to the front cloud chart resistance zone of 31442. Need to see a breakout above this cloud chart resistance zone to change outlook to bullish from bearish on the cloud chart. Critical week ahead!
We had a great rebound rally after rebounding from the 29490 support zones on the weekly cloud chart!

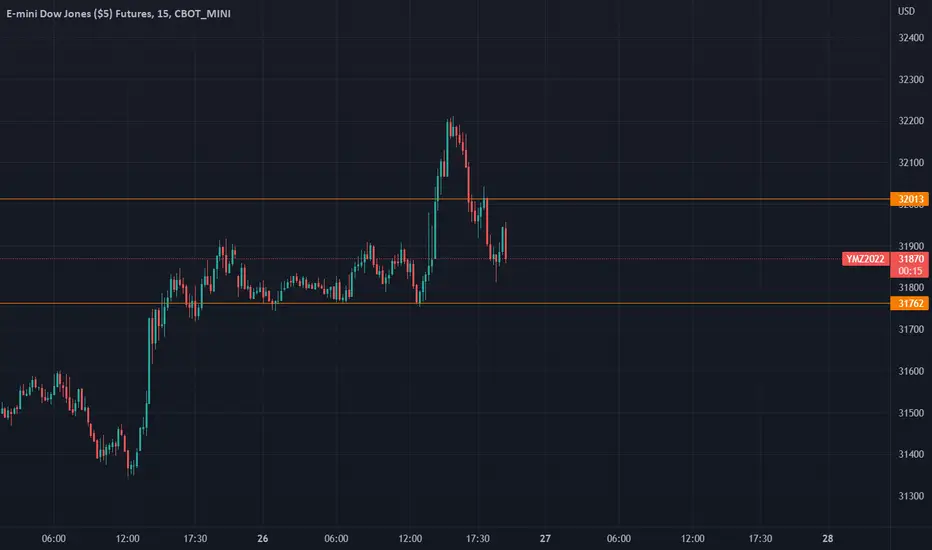
Dow Jones 31430 Target Achieved, What NextThe Dow Jones emini futures contract has achieved the primary upside objective at 31430, as 30600's now act as support, watch for bullish reversal patterns to engage on the long side targeting 31900 as the next upside objective

YM1! - Weekly Market Update, 10/24Dow futures are approaching their 50 day SMA after a rather aggressive bear market rally these past few week.
The ORANGE and BLACK channels overhead will act as resistance along with the 50 day SMA.
The market this past week was broadly oversold which is believed to support this relief rally.
All technical indicators point to a longer term bearish scenario at this time, at least until we start to see some technical and fundamental changes.
Dow Jones: Bar ExercisesOur athletic Dow Jones! After it has hopped from line to line, all the while finishing not only the overarching downwards movement in the course of wave iv in magenta but also waves (i) and (ii) in blue, the index has continued its fitness training with some bar exercises at the resistance line at 30513 points. We expect it to upswing from this mark, rising into the blue zone between 32567 and 33685 points to complete wave (iii) in blue, before starting a countermovement. However, there is a 45% chance that Dow Jones could lose its grip and drop below the support at 29640 points, thus triggering further descent below the next mark at 28635 points.

Dow Jones Targeting An Equality TestIn this update we review the recent price action in the emini Dow Jones futures contract and identify the next high probability trading opportunity and price objectives to target

these lines are too important I drew 3 lines , they will determine the direction of movement , any movement ,,,
I predict another fall !

Dow- selling at 31,000 for a short term profitsDow rally is strong but I expect some correction that may last at least 500 points?

YM - Christmas RallyI think we have a seasonal bullish commence here. There is little supply at the extreme.

Outside and Insidebar days next to each other started trendsin the past those inside bar days next to outside bar days triggered a trend changes.
due to the lower risk i like to go long above an insideday bar with the stop below the prior days low.
Lets see how long this uptrend will last
there is always the chance for a drop down below the 50% level and the trend is still going upwards...

Dow path Looking for Dow to bounce and drop on bad earnings from the banks inside the Dow this week. $3800 key level to watch.

US30USD YM1! DOW 2022 OCT 17US30USD YM1! DOW 2022 OCT 17
Support at 28886 long was fruitful.
Market is in rotation of 1800pts. Next target should be toward bottom
of rotation range 28635.
Possible scenarios:
1) Rotation play = trades to be taken at boundary of range.
2) Signs of breakout = look for higher lows / market loitering near
-> breakout of zone, --> test and accept of breakout = long
3) Signs of breakdown = look for lower highs / market loitering
near bottom of range --> breakdown of range --> Short on test and
reject of breakdown
Price reaction levels
Short on Test and Reject | Long on Test and Accept
32789 31793 31385
30513 28732 29639
29315 27741 26876
26212
Weekly: High vol up bar close off high toward middle = undecisive
Daily: Ave vol down bar close off at low = minor supply
H4: Very high vol down bar close at low = demand present
Remember to like and follow if you find this useful.
Have a profitable week ahead.

YM1! - Weekly Market Update, 10/17The indices had a rather wild week, the technicals are approaching being oversold. A bounce from here would not be unexpected as there is some consolidation occurring as price is currently hovering around the June low's area.
I'd like to see the market cycle back to an area of being overbought and finding a low risk confirmed area to short from. At this time I'm looking for thing's to setup again for a desirable entry.
I've adjusted support and resistance structures accordingly.

DOW DAILY SAY: BUY PINBAR COMES IT CAN GO TO 31700strongly advice dont pick sell.. DOW CAN GO UP WILD AND DONT ALLOW YOU CLOSE YOUR SELL .looking for buy in deep and hold it 4-5 day
if you have old sells, put SL or hedge buystop on today high
good luck

Free money! CPI news tomorrow, bull or bear, 830a eastern.Greetings Traders. Tomorrow on Thursday October 13th, 2022 is the CPI earnings report. This release happens at approximately 8:30am eastern time. However, market movement will be starting early tonight, premium collection territory.
The YM1! e-mini dow jones futures will show plenty of chart movement.
I have marked the chart. no requirement for a stop as the chart will satisfy within the purple range and touch the purple lines, all that's required is time. Once the purple line has been touched at anytime on the chart then the market has satisfied that portion of the move, that move is now marked as complete. Both purple lines will be touched, there is a lot of liquidity where the market would like to go and its marked by the purple ellipses on the chart. The purple lines also represent a 1 deviation move from the days average mean in either direction which didn't happen yesterday. Its very likely both lines at 29461 and 29165 will be touched at least once by Thursday market close late tomorrow.
Plenty of volatility for bulls and bears tomorrow! Starting Wednesday evening.
CBOT_MINI:YM1!

E-MINI DOW JONES ($5) FUTURESE-MINI DOW JONES ($5) FUTURES
The longing moves in a way that is powerful and now we have to lie down until it comes out of the great-grandfather area that we have identified.

Strategy for bear #DJI #DJIA1!I'd like to say to everyone reading this hello! I like to draw symmetrical lines and uncover hidden meanings in their relationships. This is a chart of lines I have drawn. Sometimes I like to illustrate my drawings with icons. Historiclese ensures the historical accuracy of each drawing. I hope these lines speak to you well!

3rd graph - the robots manipulationrobots integrated to all platforms and fake players (YES, there is a central AI manipulating everything) buying and selling among themselves, moving prices in the desired direction
