NQ Power Range Report with FIB Ext - 5/27/2025 SessionCME_MINI:NQM2025
- PR High: 21292.00
- PR Low: 21224.00
- NZ Spread: 152.0
Key scheduled economic events:
08:30 | Durable Goods Orders
10:00 | CB Consumer Confidence
Value increase and expected high volume following holiday weekend.
- Auctioning at Friday's high
Session Open Stats (As of 12:15 AM 5/27)
- Session Open ATR: 468.28
- Volume: 119K
- Open Int: 271K
- Trend Grade: Neutral
- From BA ATH: -6.6% (Rounded)
Key Levels (Rounded - Think of these as ranges)
- Long: 22096
- Mid: 20383
- Short: 19246
Keep in mind this is not speculation or a prediction. Only a report of the Power Range with Fib extensions for target hunting. Do your DD! You determine your risk tolerance. You are fully capable of making your own decisions.
BA: Back Adjusted
BuZ/BeZ: Bull Zone / Bear Zone
NZ: Neutral Zone
UNF1! trade ideas

NASDAQ Futures – Institutional Levels UnfoldingNASDAQ Futures – Institutional Levels Unfolding
Price is currently consolidating just below a key supply zone at 21,960–22,330, where multiple inefficiencies and prior order flow imbalances converge. The weekly narrative suggests potential expansion if buyers can reclaim 22,330, which unlocks the path toward 22,660–22,860—a macro liquidity cluster resting above.
On the downside, liquidity voids remain exposed between 20,890–20,670 and 19,850–19,400, where algorithmic rebalancing may find efficiency if sell-side pressure reactivates.
Institutional eyes are on these high-timeframe levels as the auction seeks value. Follow for real-time insights and setups based on Smart Money and Order Flow concepts.
#NQ1 #Futures #DayTrading #SmartMoney #OrderBlocks #Liquidity #MarketStructure #ICT #Trader

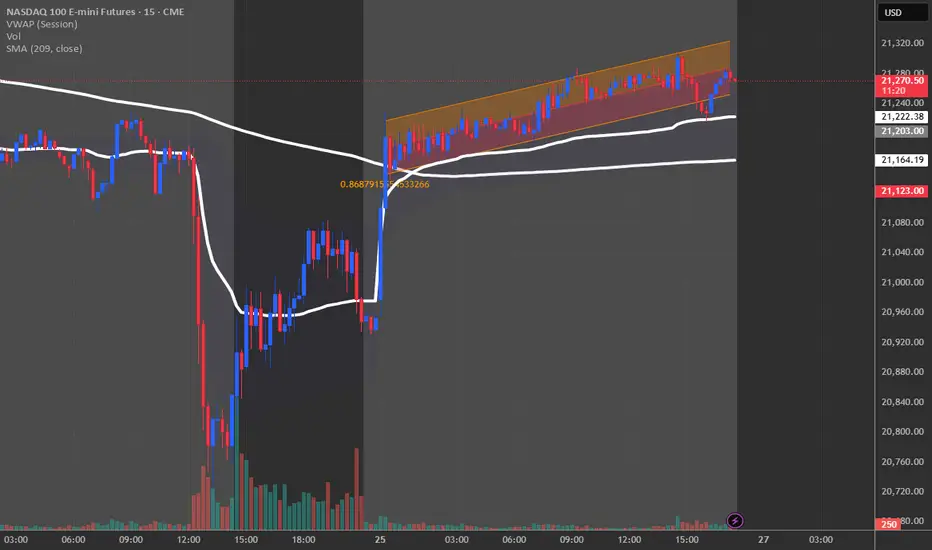
Aggressive Moves Around VWAP: The CatalystWhen NQ1 exhibits an aggressive move relative to the VWAP, it typically indicates that large players—such as institutionals and hedge funds—are taking notice. An aggressive break above the VWAP can signal strong bullish momentum, while an aggressive breakdown below it suggests equally forceful bearish pressure. In both instances, the intensity of the move often precedes a significant directional commitment from the market.
The Critical Role of Pullback Confirmation
However, the initial surge or drop isn’t enough on its own for a reliable signal. The true confirmation comes when the price pulls back to the VWAP. For instance:
Bullish Scenario: After an aggressive upward breakout, if the price retests the VWAP and forms a solid bullish (green) candle, this pullback confirmation reinforces that the move is supported by institutional buying. It reassures traders that the upward momentum isn’t a false breakout, giving greater confidence in a long position.
Bearish Scenario: Conversely, if the price aggressively falls below the VWAP and then pulls back to retest it—this time showing a strong bearish (red) candle—it signals that the downtrend is supported and genuine. The pullback confirmation filters out noise and helps avoid premature exits or entries.
This "Break + Confirmation" setup is key to distinguishing between fleeting price fluctuations and sustainable trends in NQ1.
What This Reaction Tells Us
The way NQ1 reacts when nearing the VWAP is essential in shaping trade decisions:
An aggressive move signals a readiness of the market to commit in one direction.
A subsequent pullback and confirmation via a decisive candlestick pattern validates that initial move.
This dual-phase validation offers a high-probability scenario because it not only captures the momentum but also ensures that the price level around the VWAP holds up as a pivot point.
This approach helps to avoid false breakouts, ensuring that a directional bias—either long or short—is only taken once the market has clearly reasserted its intent through a retest phase.
In Summary
Observing how NQ1 reacts around the VWAP provides powerful clues about market sentiment:
Breakout or Breakdown: Aggressive moves away from the VWAP indicate that market forces are strong.
Retest Confirmation: A pullback to the VWAP with a confirming candle (green for bullish, red for bearish) is the reliable trigger for high-probability trading entries.
Institutional Insight: These moves often mirror the actions of larger market players who are shaping the next leg of the trend.
Ultimately, the strategy revolves around patiently waiting for both the aggressive move and the subsequent confirmation to align, thereby filtering out noise and solidifying a clear trade bias.
NQ weekly forecastFor the next week, the markt will go lower to retest the weekly FVG and then go higher

Daily Chart NQ Outlook 5-25-25CME_MINI:NQ1! --- Monthly close coming up, would prefer we close monthly candle above 20666.50 (top end of M FVG), then I would like to see a retracement back into Monthly FVG and it act as a support level, then price heads back up into 22654, relative equal highs.

If Buyers Support & Defend $21K Major Key Level, I'll look LONG!CME_MINI:MNQ1!
Stick to the plan, Never doubt the process. -500K
Last week Bulls were met with Major RESITANCE as they pushed just slightly above Daily Fib. Level 78.5%. The Resistance Price Level is around $21530.00 that sellers heavily defended.
My intended Playbook; If Buyers can defend & support MKL $21K, I do believe they will purge the HIGH and head towards Daily Fib. Level 88.6% / Daily Imbalance Zone. The Pricing of these Level are around $21,949.50...
Overall My outlook is LONG this week on this Asset looking to purge the HIGH and head into more premium pricing. Daily Fib. Level 88.6 / Imbalance Zone
Remember when it comes to FRM (Financial Risk Management), our job is to MANAGE the downside costs of printing HIGHSIDE returns of $$$ consistently. Done correctly, well an abundance of fruit awaits us.
#BHM500K

2025.05.25 nasdaq weekend analysis📊 Friday Market Recap & Analysis
As previously mentioned, the trend had shifted downward, and I advised against taking long positions—short bias only.
Although the uptrend line was broken twice, one break was a fakeout and the price pulled back up.
Eventually, the red box support zone was broken, and the target was hit with a max drop of $363, resulting in a profit of around $7,260 per contract.
A rebound occurred as the US market opened, but a short-term trendline break at the close suggests Monday's market may lean downward—unless strong positive news emerges over the weekend.
🕰 Weekly Chart View (NASDAQ)
The weekly candle closed just slightly above the previous high, but not significantly—likely meaningless.
The 20-week MA is currently at 20,272.
If the NASDAQ breaks the recent low, there’s a high chance it could drop down to the 20-week MA + top of the Ichimoku Cloud.
📅 Daily Chart View (NASDAQ)
Buying pressure hasn’t fully disappeared yet—NASDAQ is still sitting above the 20-day MA, meaning the trend could revive.
However, if the 20-day MA (around 20,647) is broken, the price may fall into the orange box supply zone.
Historically, we’ve seen a box range movement between 20,400–19,300, so a break of the 20-day MA could lead to a repeat.
For long re-entry, the purple box zone (19,300–18,980) is a strong support area to watch.
✅ Conclusion
・Unless major news comes out over the weekend, Monday’s market will likely retest the 20-day MA.
・If that level breaks, the next drop could be around $1,000, which is significant.
・As always—wait patiently and take the trade when the market gives it to you.

Nasdaq and Indexes Week 22 BiasWhile the Indexes maitain a Bullish perspective on Weekly right now, I would not dare to anticipate next week "Flavour" but rather wait for The New Week Opening and if necessary till FOMC Minutes on Wednesday.
I would like to see immediate rejection from where price it's right now (allowing it to reach the IFVG starting at 20,690.00) to maintain a bullish bias rather then a deeper retrace, otherwise Bias may change on a Daily basis and pause that Weekly View for a later time .

#202521 - priceactiontds - weekly update - nasdaq futuresGood Day and I hope you are well.
comment: Not as bearish as I am on dax but I think market should not go above 21200 again and continue down. For that to happen, bears need to leave a strong bear gap somewhere. Gap down on Monday or Tuesday will likely do the trick. If the bull trend line holds and the current bear trend line breaks, There is the small possibility of another leg up but for now I can’t see that happening.
current market cycle: trading range
key levels for next week: 19000 - 21000
bull case: Bulls need to stop the selling and reverse to above 21000 fast or bears will push this much lower. If they manage to stay around 21000, more bears could doubt the strength of this selling but it’s a weak argument as of now. If bulls go only sideways around 21000 and close Monday above it, that would change a lot to the better for them. They have support from the daily 20ema until clearly broken.
Invalidation is below 20600.
bear case: Bears see a clear topping pattern with at least 3 decent tries of going above 21350 and now we have the strong selling on Friday with a total escalation of the trade war with the EU. Bears were given a gift and they need follow-through and leave a big gap that has to stay open, like the bulls did with the 3 current open gaps. Targets for the bears in order are the breakout retest 20277, 20000 and then the prior support around 19300/19400 which is around the 50% retracement.
Invalidation is above 21200.
short term: Neutral until we clearly have follow-through selling by the bears. I want to lean max bearish but need more confirmation.
medium-long term - Update from 2024-05-24: Will update this section more after the coming week but in general the thesis is as for dax. Down over the summer and sideways to up into year end. I don’t think the lows for this year are in.

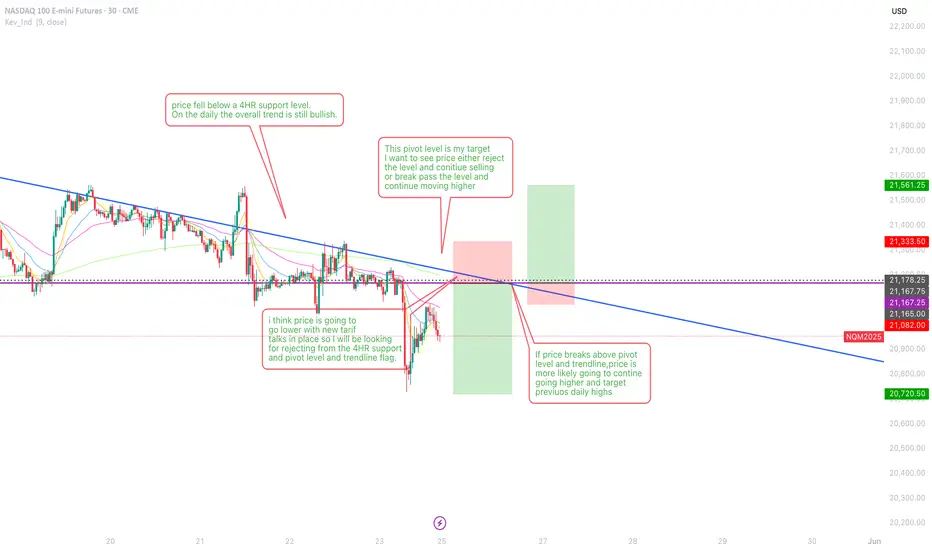
NQ and ES Market OutlookPossible Scenarios for NQ and ES this coming week, remember to always for the price to go sa mga POI natin before looking for an entry OR if you see price targeting your POI, then look for confirmations that yung POI is your target TP area.

NASDAQ 13/100 The price continued to move in a range on 15 min TF. The price has finally broken downward from the range.

NASDAQ 12/100 with two tradesI had done my analysis on NASDAQ. The market sentiment remains positive post Federal decision on interest rates.

NASDAQ Analysis 11/100 and one bumper trade !!!The market moved higher with Fed Decision on Interest rates. THe market sentiment remains positive.

NASDAQ Anaylsis 10/100 and two tradesI have done NASADAQ analysis. Trump recently announced a trade deal with UK which boosted the market sentiment. But will the rally continue?

#NQ1! "E-Mini Nasdaq 100" Index Market Bullish Robbery Plan 🌟Hi! Hola! Ola! Bonjour! Hallo! Marhaba!🌟
Dear Money Makers & Robbers, 🤑 💰💸✈️
Based on 🔥Thief Trading style technical and fundamental analysis🔥, here is our master plan to heist the NQ1! "E-Mini Nasdaq 100" Index Market Heist. Please adhere to the strategy I've outlined in the chart, which emphasizes long entry. Our aim is to escape near the high-risk YELLOW MA Zone. It's a Risky level, overbought market, consolidation, trend reversal, trap at the level where traders and bearish robbers are stronger. 🏆💸"Take profit and treat yourself, traders. You deserve it!💪🏆🎉
Entry 📈 : "The heist is on! Wait for the Crossing previous high (19800) then make your move - Bullish profits await!"
however I advise to Place Buy stop orders above the Moving average (or) Place buy limit orders within a 15 or 30 minute timeframe most recent or swing, low or high level for Pullback entries.
📌I strongly advise you to set an "alert (Alarm)" on your chart so you can see when the breakout entry occurs.
Stop Loss 🛑: "🔊 Yo, listen up! 🗣️ If you're lookin' to get in on a buy stop order, don't even think about settin' that stop loss till after the breakout 🚀. You feel me? Now, if you're smart, you'll place that stop loss where I told you to 📍, but if you're a rebel, you can put it wherever you like 🤪 - just don't say I didn't warn you ⚠️. You're playin' with fire 🔥, and it's your risk, not mine 👊."
📍 Thief SL placed at the nearest/swing low level Using the 2H timeframe (19200) Day trade basis.
📍 SL is based on your risk of the trade, lot size and how many multiple orders you have to take.
🏴☠️Target 🎯: 20500
🧲Scalpers, take note 👀 : only scalp on the Long side. If you have a lot of money, you can go straight away; if not, you can join swing traders and carry out the robbery plan. Use trailing SL to safeguard your money 💰.
💰💵💸NQ1! "E-Mini Nasdaq 100" Index Money Heist Plan is currently experiencing a bullishness,., driven by several key factors. .☝☝☝
📰🗞️Get & Read the Fundamental, Macro Economics, COT Report, Geopolitical and News Analysis, Sentimental Outlook, Intermarket Analysis, Index-Specific Analysis, Future trend targets with Overall outlook score... go ahead to check 👉👉👉🔗🔗🌎🌏🗺
⚠️Trading Alert : News Releases and Position Management 📰🗞️🚫🚏
As a reminder, news releases can have a significant impact on market prices and volatility. To minimize potential losses and protect your running positions,
we recommend the following:
Avoid taking new trades during news releases
Use trailing stop-loss orders to protect your running positions and lock in profits
💖Supporting our robbery plan 💥Hit the Boost Button💥 will enable us to effortlessly make and steal money 💰💵. Boost the strength of our robbery team. Every day in this market make money with ease by using the Thief Trading Style.🏆💪🤝❤️🎉🚀
I'll see you soon with another heist plan, so stay tuned 🤑🐱👤🤗🤩

NQ Short (05-19-25)Same plan as prior Post, Short. The play is that the NAZ will try some FA's below (Shaded Zones) and then U Turn up during some late low volume Holiday session and attempt ATH retest. No U Turn, next SZ lower. Long above KL 365 and Short below. Price Action is all about Tricks, Tweets, Games and any low volume session opportunity (long side now). Still want to retest the 15m 2,000 point blast zone.

Nasdaq futures - medium term correction is quite likely# Elliott Wave Analysis of Nasdaq 100 Futures: Critical Juncture Signals Potential Reversal
Based on the provided Elliott Wave chart analysis of the Nasdaq 100 E-mini Futures, the market appears to be at a critical inflection point where Wave 5 of the primary impulsive sequence may be nearing completion. At the current level of **20,910.75**, down **267.50 points (-1.26%)**, technical indicators suggest a potential major corrective phase could be imminent. The convergence of Elliott Wave completion patterns, RSI divergence signals, and extreme market sentiment readings creates a compelling case for heightened caution among traders.
## Elliott Wave Structure Analysis
### Current Wave Count and Positioning
The chart reveals a completed five-wave impulsive structure that began from the March 2020 lows, with Wave 5 potentially reaching its terminal point around current levels . According to Elliott Wave Theory, **Wave 5 is prone to truncation and often presents with indicator divergence** . The current structure shows classic characteristics of a maturing Wave 5, where **the fifth wave is the final leg in the direction of the dominant trend** .
The exponential moving averages positioned at **20,211.64** and **20,278.60** provide crucial support levels that align with the expected Wave 4 correction zone. Elliott Wave practitioners recognize that **Wave 4 typically retraces less than 38.2% of Wave 3** , and the current price action respects these theoretical boundaries. The fractal nature of Elliott Waves suggests that within the larger degree Wave 5, we have likely completed five sub-waves of lesser degree.
### Fibonacci Relationships and Target Zones
Elliott Wave analysis relies heavily on Fibonacci relationships between waves. The chart shows potential completion targets where **Wave 5 equals Wave 1** or represents **0.618 to 1.618 of Wave 1 plus Wave 3** . Current price levels appear to satisfy these mathematical relationships, suggesting the impulsive sequence may be mathematically complete. When **Wave 5 is extended, the most common multiple for its length is 1.618 times the length of Wave 1 through Wave 3** , which aligns with current market positioning.
## RSI Divergence Signals
### Bearish Divergence Formation
The RSI indicator at the bottom of the chart displays classic **bearish divergence characteristics**, where **price makes higher highs while RSI forms lower highs** . This divergence pattern typically occurs **when RSI is above 70, signaling that the asset is overbought** . The current RSI reading suggests that **buying pressure is fading** despite continued price advances, which **is usually a sign that the uptrend is losing strength, and a downward reversal might be coming** .
**Wave 5 almost always presents with indicator divergence** , and the RSI pattern confirms this theoretical expectation. The divergence serves as an **early warning that the uptrend might lose momentum and reverse** , providing traders with advance notice of potential trend changes before they manifest in price action.
### Momentum Deterioration
The weakening RSI momentum while prices reach new highs indicates **underlying selling pressure building beneath the surface** . This divergence pattern suggests that **institutional smart money may be distributing positions** while retail sentiment remains bullish. The divergence becomes more significant when confirmed by other technical indicators and Elliott Wave completion patterns.
## Market Sentiment Context
### Fear and Greed Index Implications
Recent market sentiment data reveals extreme volatility in investor psychology. The **CNN Fear and Greed Index plunged to just 3 on April 8, marking its lowest level since March 2020** , before recovering modestly to **8** by mid-May. These extreme fear readings historically correlate with major market turning points, though **fear of this magnitude can bring extreme volatility, often resulting in steep market declines** .
The index's current positioning suggests that while fear has dominated recent sessions, contrarian signals may be emerging. Historically, **when fear reaches extreme levels, it has marked moments of potential opportunity or further market turbulence** . The combination of extreme sentiment readings with Elliott Wave completion patterns creates a confluence of reversal signals.
### Volatility Environment
The **CBOE Nasdaq 100 Volatility Index (VXN)** has elevated to significant levels, with recent readings around **24.20** . Higher VXN levels indicate **heightened expectations of near-term price swings** and often correlate with **institutional hedging activity** . When combined with Elliott Wave completion patterns, elevated volatility readings suggest market participants are positioning for significant directional moves.
## Trading Recommendations
### Short-Term Strategy (1-4 Weeks)
**Bearish Positioning**: The confluence of Elliott Wave 5 completion, RSI divergence, and extreme sentiment readings suggests high probability of corrective action. Traders should consider **shorting rallies toward resistance zones between 21,000-21,200** with stops above Wave 5 highs. Target initial support at the **Wave 4 low around 19,000-19,500**, representing a potential **10-15% correction** .
**Risk Management**: Given the potential for **truncated Wave 5 scenarios**, where the market reverses sharply without reaching typical extension targets , position sizing should be conservative. **Limit single-trade exposure to 1-2% of capital** and maintain strict stop-loss disciplines above recent highs.
### Medium-Term Outlook (1-3 Months)
**Corrective Wave Expectations**: Following Elliott Wave theory, the completion of the five-wave impulsive sequence should trigger a **three-wave corrective pattern (A-B-C)** . Wave A corrections typically retrace **38.2% to 50% of the entire impulsive move**, suggesting potential targets in the **18,000-19,000 range**. Wave C of the correction **is typically at least as large as Wave A and often extends to 1.618 times Wave A** .
**Sector Rotation Opportunities**: During major Elliott Wave corrections, defensive sectors often outperform growth-oriented technology stocks. Consider reducing exposure to **semiconductor and cloud computing sectors**, which have shown weakness with **-9.3% and -5.8% monthly declines respectively** , while increasing allocations to utilities and consumer staples.
### Long-Term Perspective (3-12 Months)
**Accumulation Zones**: Major Elliott Wave corrections create optimal long-term accumulation opportunities. The projected **Wave A target zone between 18,000-19,000** should provide strategic entry points for patient investors. Historical analysis suggests that **Wave 2 corrections of higher degree** often retrace to previous resistance levels that become support.
**Volatility Strategies**: Elevated VXN readings and expected corrective volatility create opportunities for **volatility premium capture strategies**. Consider selling put spreads at projected support levels and buying protective calls to benefit from mean reversion following the corrective sequence.
## Risk Considerations
### Alternative Wave Counts
Elliott Wave analysis requires consideration of alternative scenarios. The current count assumes Wave 5 completion, but **complex Wave 4 patterns** could extend the impulsive sequence. If price breaks above recent highs with strong momentum, the **extended Wave 5 scenario** becomes more probable, targeting **22,500-23,000** levels .
### Macroeconomic Catalysts
**Trade policy developments** and **Federal Reserve communications** could accelerate or delay the expected corrective sequence. **Trump's tariff policies** and ongoing **US-China trade tensions** create fundamental headwinds that support the bearish Elliott Wave scenario. Monitor **employment data and inflation readings** for confirmation of economic slowdown that typically accompanies major market corrections.
## Conclusion
The Elliott Wave analysis of Nasdaq 100 Futures presents a compelling case for major trend reversal as Wave 5 approaches completion. The convergence of RSI bearish divergence, extreme sentiment readings, and theoretical wave relationships creates a high-probability setup for significant corrective action. Traders should prioritize capital preservation and position defensively while preparing for strategic accumulation opportunities in the projected correction zone. The fractal nature of Elliott Waves suggests this analysis applies across multiple timeframes, reinforcing the significance of current technical developments.
Based in AI research

NQ Futures – Smart Money Concepts (15m)📅 May 22, 2025 | Analysis by Wavervanir International LLC
We're tracking a clear distribution structure on the 15-minute NQ chart. Here's a breakdown of our thesis:
🔍 Market Structure:
Multiple CHoCHs followed by a confirmed Break of Structure (BOS) at ~21,100
Rejection from Premium Zone near 21,475–21,550
Current price is reacting around Equilibrium (0.5 FIB) at ~21,234
🧠 Smart Money Outlook:
Order blocks are aligning with a potential bearish continuation
Expecting a move towards the Discount Zone between 21,040–21,000
Below that, confluence builds near the 1.272–1.414 FIB extension, targeting 20,845.75
📉 Projection:
We're looking for a liquidity sweep below the weak low (~21,040), followed by a potential reaction at 20,845.75. Volume is spiking near bearish zones—suggesting institutional unloading.
🔻 Probability favors downside continuation toward the blue liquidity pool.
📍 Short Bias remains valid unless invalidated above 21,350.
#NQ #NASDAQ100 #SmartMoney #S&P500 #VolumeProfile #Fibonacci #Liquidity #TradingView #WavervanirAnalysis #FuturesTrading #PriceAction #RiskManagement

NASDAQ - Target Zone - Break of channel - ShortNASDAQ - Target Zone - Break of channel - Short
We can have a rebound phase with new short phase
target area 19000

PIVOTAL FRIDAYToday, market makers will decide who is going to drive the train for the next weeks and months.
Since Monday, May 19, the NASDAQ index has been posting lower highs and lower lows.
Yesterday it closed higher than the opening prices.
The line in the sand is at 21,040.
If we close today below this level, bears take the driver's seat.
It might take us to the 19,900 support level (meaning a 6% decline from the current levels).
From there, we would likely visit new lows again, which would be catastrophic for investors and the American economy in general.
Also, it would nuke crypto prices.
In that scenario, forget about "alt season".
Sell all your crypto assets and short the market.
Bitcoin and crypto follow NASDAQ, not the other way around.
In times like these, it’s not about predicting the future — it’s about preparing for it.
Today’s close will likely set the tone for Q2 and beyond.
Whether you’re long, short, or sidelined, understand the stakes: we’re at an inflection point.
Stay sharp, stay nimble.

London session short NQFirst time in my life i understood price the whole leg down and why it was doing what it was doing.

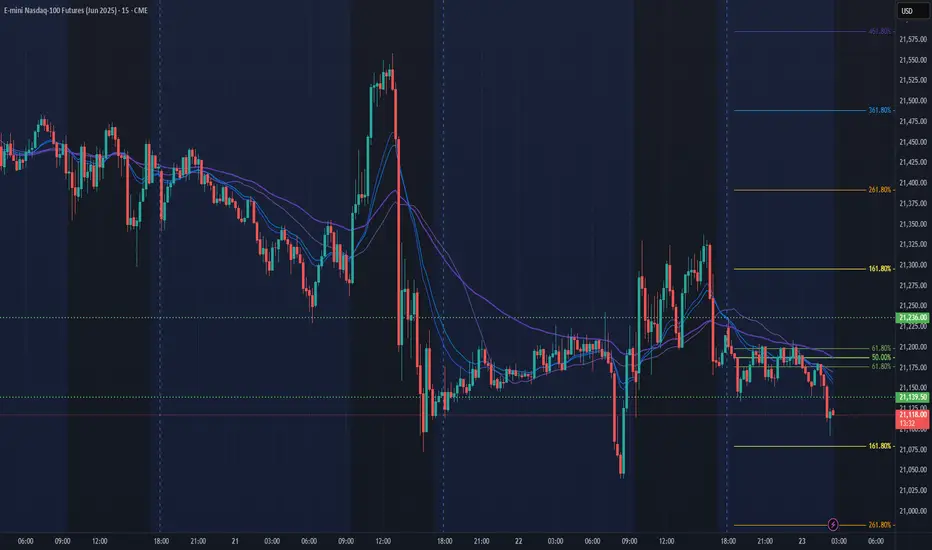
NQ Power Range Report with FIB Ext - 5/23/2025 SessionCME_MINI:NQM2025
- PR High: 21236.00
- PR Low: 21139.00
- NZ Spread: 217.0
Key scheduled economic events:
10:00 | New Home Sales
Early close Monday
- Previous session closed as daily inside print
- Overall sentiment unchanged
Session Open Stats (As of 12:45 AM 5/23)
- Session Open ATR: 447.96
- Volume: 29K
- Open Int: 277K
- Trend Grade: Neutral
- From BA ATH: -6.6% (Rounded)
Key Levels (Rounded - Think of these as ranges)
- Long: 22096
- Mid: 20383
- Short: 19246
Keep in mind this is not speculation or a prediction. Only a report of the Power Range with Fib extensions for target hunting. Do your DD! You determine your risk tolerance. You are fully capable of making your own decisions.
BA: Back Adjusted
BuZ/BeZ: Bull Zone / Bear Zone
NZ: Neutral Zone