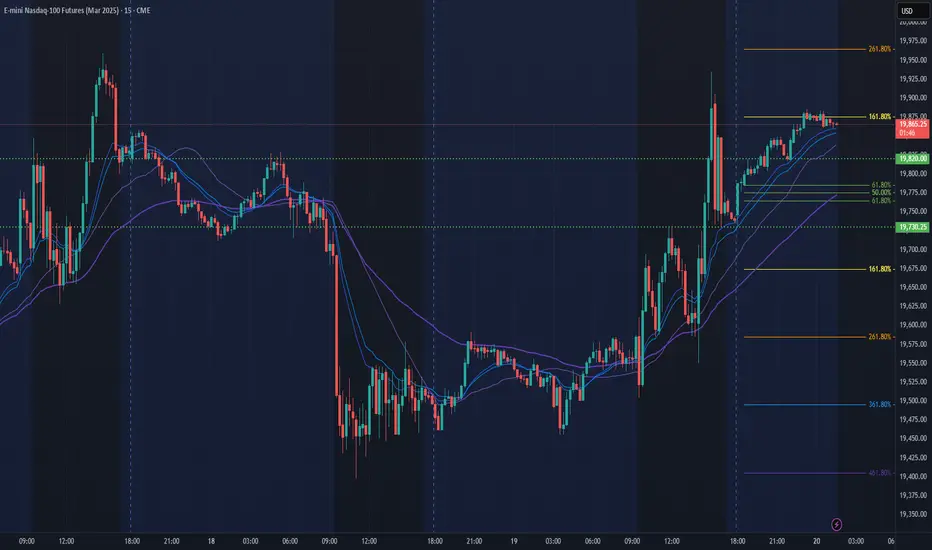
NQ Short (03-21-25)YTD 4 HR chart and the planets are aligned. Looks or if 20,142 is rejection zone, we may retest 19,400. Long above 20,142 and Short below. 17,027 is 2024 Open Price, FYI. Follower's, I am taking a few weeks off and will Post what I can. Do not chase, remind yourself the O/N is The BOSS and has magical powers. Why is there a -7% limit down and NO limit UP?
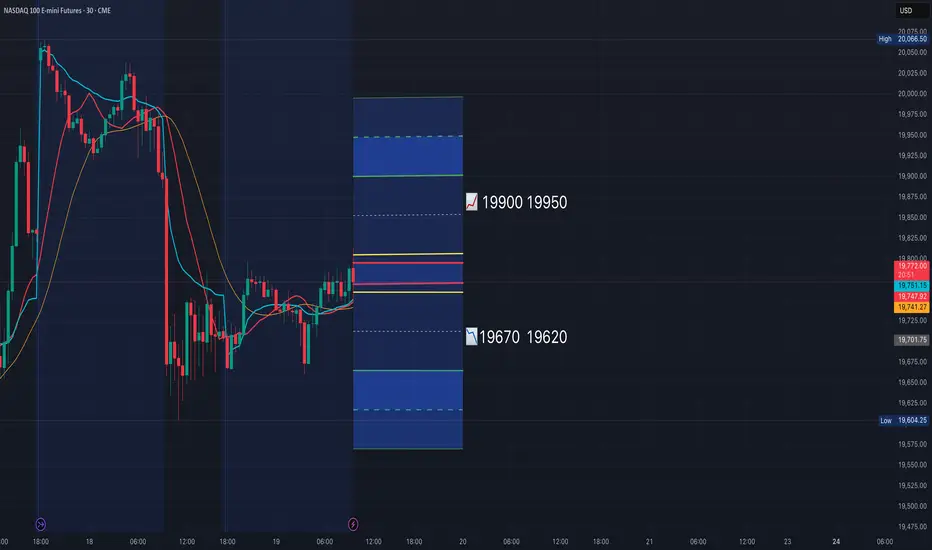
30M Chart
UNF1! trade ideas

NQ! 100R TF morning markupHey yall! No news today it’s a little quite so of course I marked up both ways for a buy and sell. You can choose to put in both and see which one takes off! There is a ‘W’ forming so it will be interesting if she keeps rallying up for the buy or drop for the sell at the point of resistance and fall heavy. As always SL is wide at 120 points and feel free to change your levels as you see fit. Please use proper risk management and follow your plan!! GOOD LUCK :)

Short it once price returns to the fair value gapPrice is tapping southside liquidity, and the daily bias is lower

NQ Power Range Report with FIB Ext - 3/21/2025 SessionCME_MINI:NQM2025
- PR High: 19909.75
- PR Low: 19880.00
- NZ Spread: 66.75
No key scheduled economic events
Maintaining 2 week range, inside previous session range near the close
- Previous session closed inside print
- Advertising rotation back to week lows (constantly has been used for liquidity)
- Relatively tight PR
Session Open Stats (As of 12:55 AM 3/21)
- Session Open ATR: 459.60
- Volume: 26K
- Open Int: 226K
- Trend Grade: Neutral
- From BA ATH: -12.3% (Rounded)
Key Levels (Rounded - Think of these as ranges)
- Long: 20954
- Mid: 19814
- Short: 18675
Keep in mind this is not speculation or a prediction. Only a report of the Power Range with Fib extensions for target hunting. Do your DD! You determine your risk tolerance. You are fully capable of making your own decisions.
BA: Back Adjusted
BuZ/BeZ: Bull Zone / Bear Zone
NZ: Neutral Zone

breakdown of the two trades on NQ1! 20-03-2025 This is a brief breakdown of the two trades i took today on nasdaq 20/03/2025

2025-03-20 - priceactiontds - daily update - nasdaqGood Evening and I hope you are well.
nasdaq e-mini futures
comment: Market is contracting and I highly doubt tomorrow will bring the breakout. Next week we will either see the beginning of a big second leg down for the bears or a higher pullback to maybe 21k. The past days market has gone nowhere and mean reversion was the money printer 19900 is the fair price for now and anything above 20165 or below 19600 would surprise me. Market is in total balance but since bulls could not get a decent pullback, bears are favored to continue the bear trend.
current market cycle: strong bear trend but currently in W2
key levels: 19600 - 20200
bull case: Bulls have strong legs from higher lows up to print lower highs. They are quick to exit and lock in profits, since bears have demonstrated strength for 5 weeks straight. This week the pullback should have gone much higher and it was a really bad week for bulls. Likely more pain to come. Whats the likelihood of a strong bull trend day tomorrow? Very, very low. We are in a bear flag on the daily chart and bulls have tried for 3 days now to make higher highs. I doubt it will work on Opex. Many times the market will oscillate around the price where market makers want it to close into Opex. This does seem to be such a week.
Invalidation is below 19604.
bear case: Bears are doing what they needed to, in order to make this bear trend really look like one and a strong one at that. They are currently fine with 19900 and going sideways, knowing that the odds of a trend resumption down are greater for them than a surprise bull breakout.
short term: Neutral around 19900. Bearish below 19600 and bullish above 20200 but the signals would have to be insanely strong for me to take them. Mean reversion was key this week and I won’t do dumb things on Opex.
medium-long term - Update from 2024-03-16: My most bearish target for 2025 was 17500ish, given in my year-end special. We don’t know if we have printed the W1 of the new bear trend or repeat the pattern from 2024, where we sold of very strong to reverse even more strongly and make new all time highs. Market needs a bounce and around 20000/20500 we will see the real battle for the next weeks.
trade of the day: Bars 66 to 86 were strong enough and had 3 legs up. Market then was close enough to previous resistance and bears printed stronger bear bars 91, 5+6, 8 and 15 -17. 18 was the absolute latest you had to get short, since market demonstrated more than enough at that point, that it does not want to go up anymore. Short with a stop above y high was banger.
Could you have taken the long from 19765 up to 20100? Certainly not on Bar 24 or 25 but bar 35 was a huge bull surprise on the open and we printed a double bottom at y low. Longs since bar 36 were decent with 200 points upside potential while stop had to be 150 points.

NQ: 158th trading session - recapSomething pretty rare happened today: No scalps, that is crazy.
I blame this on (obviously) the conditions: I trade less in moving conditions + I was just really unlucky for price to range that way, disgusting stuff man.
Won't trade tomorrow (thanks again for the time change in CET which is only for March, dumb system mannnnn)
But I mean it's a good sign: I'm annoyed that I can't trade tomorrow, that doesn't only show commitment, but also obsession.

NQ Short (03-20-25)I may be early (or excited) with the call, it is on the way. O/N lift play is loosing the effectiveness, NAZ needs that for stability (and drop offsets). Anyway, should be on the way tomorrow. Any drop will have to get in front of the Friday-Monday long play (longer overnight trick). Under 19,665 is the express freight train lower and a hold will try another U Turn.

Nasdaq: Wave A Done – Now Lining Up for a Strong BounceThe Nasdaq is starting to look really interesting here. In my view, we've completed Wave ((a)) to the downside—a clean (abc) correction. Why do I think it's done? Because we've just tapped into a Fair Value Gap (FVG) and saw a strong reaction, just above last year’s VWAP, which I always consider a key reference point on the higher time frame.
Ideally, I would have liked to see that 19,090 level get tagged—unfortunately, we didn’t quite reach it. But honestly, this reaction is solid enough to still keep the bullish scenario intact.
Adding to that, the RSI is now in oversold territory, and the last two times we’ve seen that, it was followed by strong upward moves. Based on all of this, I’m expecting a solid bounce over the coming weeks, likely lasting into Q1 or even Q2 2025 .
Where could this move take us? I see two key zones: the first between 22,000 and 22,425 and the second between 23,320 and 23,675. Could it land somewhere in between? Sure. But one of those zones is where I expect this corrective structure to wrap up. That would likely complete the larger ((abc)) correction, after which we’ll finally begin forming the macro Wave A—which will open the next big leg of structure.
So the bigger picture is in play here. In the meantime, I’ll be hunting for entries on the lower time frames, because I do think we’re setting up for a pretty solid push on this index in the coming weeks.

MNQ!/NQ1! Day Trade Plan for 03/20/2025MNQ!/NQ1! Day Trade Plan for 03/20/2025
📈19850 19900
📉19760 19670
Like and share for more daily NQ levels 🤓📈📉🎯💰
*These levels are derived from comprehensive backtesting and research and a quantitative system demonstrating high accuracy. This statistical foundation suggests that price movements are likely to exceed initial estimates.*

NQ Power Range Report with FIB Ext - 3/20/2025 SessionCME_MINI:NQM2025
- PR High: 20026.25
- PR Low: 19944.25
- NZ Spread: 183.5
Key scheduled economic events:
08:30 | Initial Jobless Claims
- Philadelphia Fed Manufacturing
10:00 | Existing Home Sales
Auctioning in previous session highs above the close
- Maintaining weekly range below 20200
- Advertising daily rotation back to Keltner average cloud
Session Open Stats (As of 12:55 AM 3/20)
- Session Open ATR: 472.57
- Volume: 26K
- Open Int: 213K
- Trend Grade: Neutral
- From BA ATH: -10.8% (Rounded)
Key Levels (Rounded - Think of these as ranges)
- Long: 20954
- Mid: 19814
- Short: 18675
Keep in mind this is not speculation or a prediction. Only a report of the Power Range with Fib extensions for target hunting. Do your DD! You determine your risk tolerance. You are fully capable of making your own decisions.
BA: Back Adjusted
BuZ/BeZ: Bull Zone / Bear Zone
NZ: Neutral Zone
MNQ!/NQ1! Day Trade Plan for 03/18/2025MNQ!/NQ1! Day Trade Plan for 03/18/2025
📈20040 20085
📉19670 19620
Like and share for more daily NQ levels 🤓📈📉🎯💰
*These levels are derived from comprehensive backtesting and research and a quantitative system demonstrating high accuracy. This statistical foundation suggests that price movements are likely to exceed initial estimates.*

MNQ!/NQ1! Day Trade Plan for 03/19/2025MNQ!/NQ1! Day Trade Plan for 03/19/2025
📈19900 19950
📉19670 19620
Like and share for more daily NQ levels 🤓📈📉🎯💰
*These levels are derived from comprehensive backtesting and research and a quantitative system demonstrating high accuracy. This statistical foundation suggests that price movements are likely to exceed initial estimates.*
NQ Range (03-19-25)NAZ TLX 19,767 is long above and short below, Scalp inside yellow vertical arrow range until break out. Garbage Day #2 (recycle). We may need some media, spin, etc. to lift it or lower we go. O/N seems to be loosing upward rig force and Reg Session seems to sell off. Today should be interesting.

Review of my NQ Morning trade before FOMCThis is me going over the trade we took today that was a loss. Had we kept SL under the low of 19,541.25 we would've hit TP and caught our trade. We are done trading for today, just wanted to hop on here to share with you guys the result of the trade and outcome.
Give it a like ♥ and a 🚀 if you found this insightful.
Forex, Crypto and Futures Trading Risk Disclosure:
The National Futures Association (NFA) and Commodity Futures Trading Commission (CFTC), the regulatory agencies for the forex and futures markets in the United States, require that customers be informed about potential risks in trading these markets. If you do not fully understand the risks, please seek advice from an independent financial advisor before engaging in trading.
Trading forex and futures on margin carries a high level of risk and may not be suitable for all investors. The high degree of leverage can work against you as well as for you. Before deciding to trade, you should carefully consider your investment objectives, level of experience, and risk appetite.
There is a possibility of losing some or all of your initial investment, and therefore, you should not invest money that you cannot afford to lose. Be aware of the risks associated with leveraged trading and seek professional advice if necessary.
BDRipTrades Market Opinions (also applies to BDelCiel and Aligned & Wealthy LLC):
Any opinions, news, research, analysis, prices, or other information contained in my content (including live streams, videos, and posts) are provided as general market commentary only and do not constitute investment advice. BDRipTrades, BDelCiel, and Aligned & Wealthy LLC will not accept liability for any loss or damage, including but not limited to, any loss of profit, which may arise directly or indirectly from the use of or reliance on such information.
Accuracy of Information: The content I provide is subject to change at any time without notice and is intended solely for educational and informational purposes. While I strive for accuracy, I do not guarantee the completeness or reliability of any information. I am not responsible for any losses incurred due to reliance on any information shared through my platforms.
Government-Required Risk Disclaimer and Disclosure Statement:
CFTC RULE 4.41 - HYPOTHETICAL OR SIMULATED PERFORMANCE RESULTS HAVE CERTAIN LIMITATIONS. UNLIKE AN ACTUAL PERFORMANCE RECORD, SIMULATED RESULTS DO NOT REPRESENT ACTUAL TRADING. ALSO, SINCE THE TRADES HAVE NOT BEEN EXECUTED, THE RESULTS MAY HAVE UNDER-OR-OVER COMPENSATED FOR THE IMPACT, IF ANY, OF CERTAIN MARKET FACTORS, SUCH AS LACK OF LIQUIDITY. SIMULATED TRADING PROGRAMS IN GENERAL ARE ALSO SUBJECT TO THE FACT THAT THEY ARE DESIGNED WITH THE BENEFIT OF HINDSIGHT. NO REPRESENTATION IS BEING MADE THAT ANY ACCOUNT WILL OR IS LIKELY TO ACHIEVE PROFIT OR LOSSES SIMILAR TO THOSE SHOWN.
Performance results discussed in my content are hypothetical and subject to limitations. There are frequently sharp differences between hypothetical performance results and the actual results subsequently achieved by any particular trading strategy. One of the limitations of hypothetical trading results is that they do not account for real-world financial risk.
Furthermore, past performance of any trading system or strategy does not guarantee future results.
General Trading Disclaimer:
Trading in futures, forex, and other leveraged products involves substantial risk and is not appropriate for all investors.
Do not trade with money you cannot afford to lose.
I do not provide buy/sell signals, financial advice, or investment recommendations.
Any decisions you make based on my content are solely your responsibility.
By engaging with my content, including live streams, videos, educational materials, and any communication through my platforms, you acknowledge and accept that all trading decisions you make are at your own risk. BDRipTrades, BDelCiel, and Aligned & Wealthy LLC cannot and will not be held responsible for any trading losses you may incur.


Pt. 2 of Navigating NQ during FOMCPart 2. Continuation showing my thoughts and trade stop out.
Forex, Crypto and Futures Trading Risk Disclosure:
The National Futures Association (NFA) and Commodity Futures Trading Commission (CFTC), the regulatory agencies for the forex and futures markets in the United States, require that customers be informed about potential risks in trading these markets. If you do not fully understand the risks, please seek advice from an independent financial advisor before engaging in trading.
Trading forex and futures on margin carries a high level of risk and may not be suitable for all investors. The high degree of leverage can work against you as well as for you. Before deciding to trade, you should carefully consider your investment objectives, level of experience, and risk appetite.
There is a possibility of losing some or all of your initial investment, and therefore, you should not invest money that you cannot afford to lose. Be aware of the risks associated with leveraged trading and seek professional advice if necessary.
BDRipTrades Market Opinions (also applies to BDelCiel and Aligned & Wealthy LLC):
Any opinions, news, research, analysis, prices, or other information contained in my content (including live streams, videos, and posts) are provided as general market commentary only and do not constitute investment advice. BDRipTrades, BDelCiel, and Aligned & Wealthy LLC will not accept liability for any loss or damage, including but not limited to, any loss of profit, which may arise directly or indirectly from the use of or reliance on such information.
Accuracy of Information: The content I provide is subject to change at any time without notice and is intended solely for educational and informational purposes. While I strive for accuracy, I do not guarantee the completeness or reliability of any information. I am not responsible for any losses incurred due to reliance on any information shared through my platforms.
Government-Required Risk Disclaimer and Disclosure Statement:
CFTC RULE 4.41 - HYPOTHETICAL OR SIMULATED PERFORMANCE RESULTS HAVE CERTAIN LIMITATIONS. UNLIKE AN ACTUAL PERFORMANCE RECORD, SIMULATED RESULTS DO NOT REPRESENT ACTUAL TRADING. ALSO, SINCE THE TRADES HAVE NOT BEEN EXECUTED, THE RESULTS MAY HAVE UNDER-OR-OVER COMPENSATED FOR THE IMPACT, IF ANY, OF CERTAIN MARKET FACTORS, SUCH AS LACK OF LIQUIDITY. SIMULATED TRADING PROGRAMS IN GENERAL ARE ALSO SUBJECT TO THE FACT THAT THEY ARE DESIGNED WITH THE BENEFIT OF HINDSIGHT. NO REPRESENTATION IS BEING MADE THAT ANY ACCOUNT WILL OR IS LIKELY TO ACHIEVE PROFIT OR LOSSES SIMILAR TO THOSE SHOWN.
Performance results discussed in my content are hypothetical and subject to limitations. There are frequently sharp differences between hypothetical performance results and the actual results subsequently achieved by any particular trading strategy. One of the limitations of hypothetical trading results is that they do not account for real-world financial risk.
Furthermore, past performance of any trading system or strategy does not guarantee future results.
General Trading Disclaimer:
Trading in futures, forex, and other leveraged products involves substantial risk and is not appropriate for all investors.
Do not trade with money you cannot afford to lose.
I do not provide buy/sell signals, financial advice, or investment recommendations.
Any decisions you make based on my content are solely your responsibility.
By engaging with my content, including live streams, videos, educational materials, and any communication through my platforms, you acknowledge and accept that all trading decisions you make are at your own risk. BDRipTrades, BDelCiel, and Aligned & Wealthy LLC cannot and will not be held responsible for any trading losses you may incur.

Navigating PRE FOMC on NQTrade Idea for NQ, we could've captured a good amount of points, I was targeting higher buyside liquidity so it led to this trade being stopped out. Total loss was around -$19 after shifting sl near BE.
Pt. 2 for this trade where I show you my stop out will be posted next.
Forex, Crypto and Futures Trading Risk Disclosure:
The National Futures Association (NFA) and Commodity Futures Trading Commission (CFTC), the regulatory agencies for the forex and futures markets in the United States, require that customers be informed about potential risks in trading these markets. If you do not fully understand the risks, please seek advice from an independent financial advisor before engaging in trading.
Trading forex and futures on margin carries a high level of risk and may not be suitable for all investors. The high degree of leverage can work against you as well as for you. Before deciding to trade, you should carefully consider your investment objectives, level of experience, and risk appetite.
There is a possibility of losing some or all of your initial investment, and therefore, you should not invest money that you cannot afford to lose. Be aware of the risks associated with leveraged trading and seek professional advice if necessary.
BDRipTrades Market Opinions (also applies to BDelCiel and Aligned & Wealthy LLC):
Any opinions, news, research, analysis, prices, or other information contained in my content (including live streams, videos, and posts) are provided as general market commentary only and do not constitute investment advice. BDRipTrades, BDelCiel, and Aligned & Wealthy LLC will not accept liability for any loss or damage, including but not limited to, any loss of profit, which may arise directly or indirectly from the use of or reliance on such information.
Accuracy of Information: The content I provide is subject to change at any time without notice and is intended solely for educational and informational purposes. While I strive for accuracy, I do not guarantee the completeness or reliability of any information. I am not responsible for any losses incurred due to reliance on any information shared through my platforms.
Government-Required Risk Disclaimer and Disclosure Statement:
CFTC RULE 4.41 - HYPOTHETICAL OR SIMULATED PERFORMANCE RESULTS HAVE CERTAIN LIMITATIONS. UNLIKE AN ACTUAL PERFORMANCE RECORD, SIMULATED RESULTS DO NOT REPRESENT ACTUAL TRADING. ALSO, SINCE THE TRADES HAVE NOT BEEN EXECUTED, THE RESULTS MAY HAVE UNDER-OR-OVER COMPENSATED FOR THE IMPACT, IF ANY, OF CERTAIN MARKET FACTORS, SUCH AS LACK OF LIQUIDITY. SIMULATED TRADING PROGRAMS IN GENERAL ARE ALSO SUBJECT TO THE FACT THAT THEY ARE DESIGNED WITH THE BENEFIT OF HINDSIGHT. NO REPRESENTATION IS BEING MADE THAT ANY ACCOUNT WILL OR IS LIKELY TO ACHIEVE PROFIT OR LOSSES SIMILAR TO THOSE SHOWN.
Performance results discussed in my content are hypothetical and subject to limitations. There are frequently sharp differences between hypothetical performance results and the actual results subsequently achieved by any particular trading strategy. One of the limitations of hypothetical trading results is that they do not account for real-world financial risk.
Furthermore, past performance of any trading system or strategy does not guarantee future results.
General Trading Disclaimer:
Trading in futures, forex, and other leveraged products involves substantial risk and is not appropriate for all investors.
Do not trade with money you cannot afford to lose.
I do not provide buy/sell signals, financial advice, or investment recommendations.
Any decisions you make based on my content are solely your responsibility.
By engaging with my content, including live streams, videos, educational materials, and any communication through my platforms, you acknowledge and accept that all trading decisions you make are at your own risk. BDRipTrades, BDelCiel, and Aligned & Wealthy LLC cannot and will not be held responsible for any trading losses you may incur.

NQ Power Range Report with FIB Ext - 3/19/2025 SessionCME_MINI:NQM2025
- PR High: 19723.00
- PR Low: 19666.25
- NZ Spread: 126.75
Key scheduled economic events:
09:30 | Crude Oil Inventories
14:00 | FOMC Economic Projections
FOMC Statement
Fed Interest Rate Decision
14:30 | FOMC Press Conference
Majority of volume in contract month M
- Counter breakout close of previous session
- Rotating back inside previous week range towards 19400 inventory
- AMP margins temporarily increased in preparation for Fed events
Session Open Stats (As of 12:55 AM 3/19)
- Session Open ATR: 472.38
- Volume: 32K
- Open Int: 194K
- Trend Grade: Neutral
- From BA ATH: -12.0% (Rounded)
Key Levels (Rounded - Think of these as ranges)
- Long: 20954
- Mid: 19814
- Short: 18675
Keep in mind this is not speculation or a prediction. Only a report of the Power Range with Fib extensions for target hunting. Do your DD! You determine your risk tolerance. You are fully capable of making your own decisions.
BA: Back Adjusted
BuZ/BeZ: Bull Zone / Bear Zone
NZ: Neutral Zone

identified a rising wedge i identified a rising wedge and that was all she wrote , rising wedges are downward indications.

2025-03-18 - priceactiontds - daily update - nasdaqGood Evening and I hope you are well.
comment: Neutral. Today was really bad for the bulls. The rejection from 20000 should not have go so deep. I now think we will likely chop between 19000 - 20000 until Opex. Bulls had the momentum on their side and the breakout above 20100 was strong enough to go higher but here we are. Lows 19346 have to hold or we flush to 19k. Around 19700 I’d rather do jack shit. 50% of this range is Monday’s low at 19755m which was also late resistance today.
current market cycle: strong bear trend but pullback expected
key levels: 19000 - 21000
bull case: Bulls did good and then fumbled it hard. They now need to keep this a higher low above 19346 or we could flush down to 19000. Technically this is a trading range 19300 - 20200 and we could make lower lows and higher highs in this range, give or take. My assumption was stronger buying into opex but for that we needed to stay above 19700ish. Now what could convince me that this could become a strong short squeeze into Friday? Immediate reversal during Globex and a grind up to 20000 before EU opens. Very very unlikely. One last tiny argument bulls could have is the retest one but for that today’s low has to hold and we just have to grind up.
Invalidation is below 19604.
bear case: Bears outdoing themselves currently. Strong surprise today and now I think any upside is likely limited to around 21200. If bears are really strong, we make lower lows tomorrow and then chop into Opex on Friday. I see this as low probability and I would prefer sideways inside the current range.
short term: Neutral around 19700. Bearish around 20000 if bears come around again and bullish if we reverse strongly from either 19600 or 19400.
medium-long term - Update from 2024-03-16: My most bearish target for 2025 was 17500ish, given in my year-end special. We don’t know if we have printed the W1 of the new bear trend or repeat the pattern from 2024, where we sold of very strong to reverse even more strongly and make new all time highs. Market needs a bounce and around 20000/20500 we will see the real battle for the next weeks.
trade of the day: Long during EU session was decent but more so for dax. This short on US open obviously but I don’t think it was easy, given the bullishness before.

NQ: 157th trading session - recapStarted scalping on my TopStep eval today, went pretty well.
I needed a bit of a push cause the last few days were pretty hard - mental stuff and so on yk I got a social life. But I'm back and I'm ready to attack the market...

NQ: 156th trading session - recapForgot to post it - nothing happened anyways
Next session ima giva a bit more details, so the session today, I started with scalping on my funded account (eval)
