UNF1! trade ideas

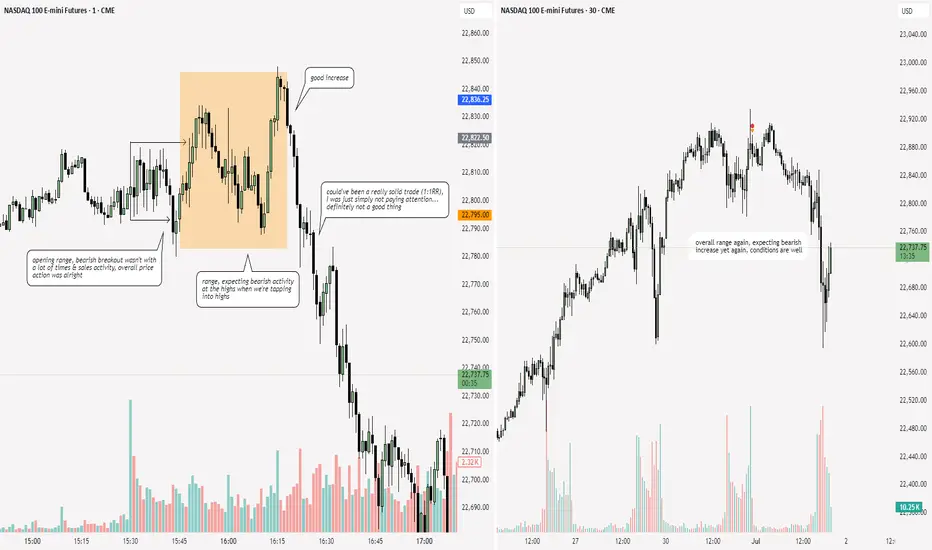
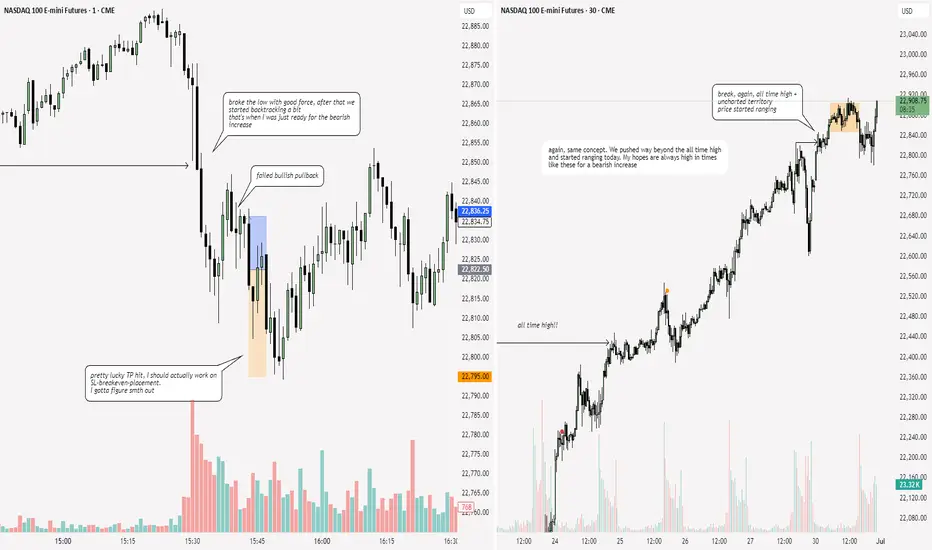
NQ: 214th trading session - recapI traded today and I also will tomorrow, today was unexpectitly: I just had time and tomorrow we won't have school past 1:00pm due to the heatwave arriving in germany.
Pretty lucky.
I'm not too harsh on myself not not being focused, I arrived at my setup 5-min before the session started, had no coffee, ran off of way too little sleep + I was sweating from the heat.
JULY 1ST 2025 10a4h PO3Daily Bias = Bullish
4h Candle Closure Bias = Bullish
Structural Bias = Bullish
Waiting for 15m Liquidity Sweep or Tap into 15m BISI
Entry = 3m +CISD
Partial = 6a4h Candle High
Runner = June 30th 2025 High or greater

NQ NY Session longBy the looks of the London Session for NQ, it seems to be a Manipulation to prepare a reversal Long in the NY Session

Expection for NQ London and NY SessionHi everyone, I expect London to Manipulate up, or down. The NY Move will then be a reversal of this move.
IF we stay in the Asian Range I expect the NY Session to take out either high, or low and then reverse to the opposite

NQ Power Range Report with FIB Ext - 7/1/2025 SessionCME_MINI:NQU2025
- PR High: 22886.75
- PR Low: 22852.50
- NZ Spread: 76.75
Key scheduled economic events:
09:30 | Fed Chair Powell Speaks
09:45 | S&P Global Manufacturing PMI
10:00 | ISM Manufacturing PMI
- ISM Manufacturing Services
- JOLTs Job Openings
Holding in ATH range
Session Open Stats (As of 12:45 AM 7/1)
- Session Open ATR: 329.32
- Volume: 21K
- Open Int: 269K
- Trend Grade: Neutral
- From BA ATH: -0.1% (Rounded)
Key Levels (Rounded - Think of these as ranges)
- Long: 23239
- Mid: 21525
- Short: 20383
Keep in mind this is not speculation or a prediction. Only a report of the Power Range with Fib extensions for target hunting. Do your DD! You determine your risk tolerance. You are fully capable of making your own decisions.
BA: Back Adjusted
BuZ/BeZ: Bull Zone / Bear Zone
NZ: Neutral Zone

July Seasonality Patterns For Index, Metals and ForexSeasonality can be a useful tool if used wisely (and in context) with current sentiment and news flows. Seasonality really is a backwards looking indicator that can easily be overpowered by key macro drivers. But its strength comes in to play when seasonality aligns with the macro landscape.
With that in mind, I share my seasonality matrix for indices, metals and USD FX pairs to highlight potential patterns for July, then wrap up with an update on my Nasdaq 100 analysis.
Matt Simpson, Market Analyst at City Index and Forex.com.

Nasdaq (NQ) Continues Bullish Cycle, Reaching New All-Time HighThe Nasdaq (NQ) has surged to a new all-time high, reaffirming the strength of its ongoing bullish trend. The index established a significant low on April 7, 2025, at 16,460, following a sell-off triggered by tariff war concerns. This low marked a critical turning point, from which the Nasdaq embarked on a robust upward trajectory, unfolding in a five-wave impulse structure as per Elliott Wave analysis.
From the April 7 low, wave 1 peaked at 18,357.25. A corrective wave 2 then followed which bottomed at 16,735. The index then rallied in wave 3, reaching 22,222, before a shallow wave 4 pullback concluded at 21,565.17, as illustrated on the one-hour chart. Currently, wave 5 is in progress, exhibiting an internal impulse structure in a lesser degree. Within this wave 5, wave (i) topped at 21,944.25, with wave (ii) finding support at 21,738.25. Wave (iii) extended to 22,915, followed by a wave (iv) correction that ended at 22,781. The final wave (v) is expected to conclude soon, completing wave ((i)) of the higher-degree wave 5.
Looking ahead, a wave ((ii)) pullback is anticipated to correct the cycle from the June 23, 2025 low, likely unfolding in a 3, 7, or 11-swing pattern before the index resumes its ascent. In the near term, as long as the pivot low at 21,565.17 holds, any dips should find support in a 3, 7, or 11-swing structure, paving the way for further upside. This technical outlook underscores the Nasdaq’s resilience and potential for continued gains, provided key support levels remain intact.

NASDAQ: Minor Pullback, Still on TrackOn Friday, the Nasdaq experienced a slight pullback, which was quickly absorbed at the start of the week. Currently, the index is still developing the turquoise wave B, which should top out just below resistance at 23,780 points, signaling the start of the bearish wave C. This move should lead to the low of the magenta wave (4) within our turquoise Target Zone between 17,074 and 15,867 points. Alternatively, there is a 42% probability that wave alt.(4) is already complete. In this scenario, the magenta wave alt.(5) could carry the index immediately above the mentioned resistance.
📈 Over 190 precise analyses, clear entry points, and defined Target Zones - that's what we do.

NQ Range (06-30-25)Same old plays keep repeating: Long in O/N and Dump at Open Drive then sideways to the Close. Today, look short under 881. You can Scalp Shorts or take Longs at any drop/hold. Holiday week so look Long as the volume will be light.

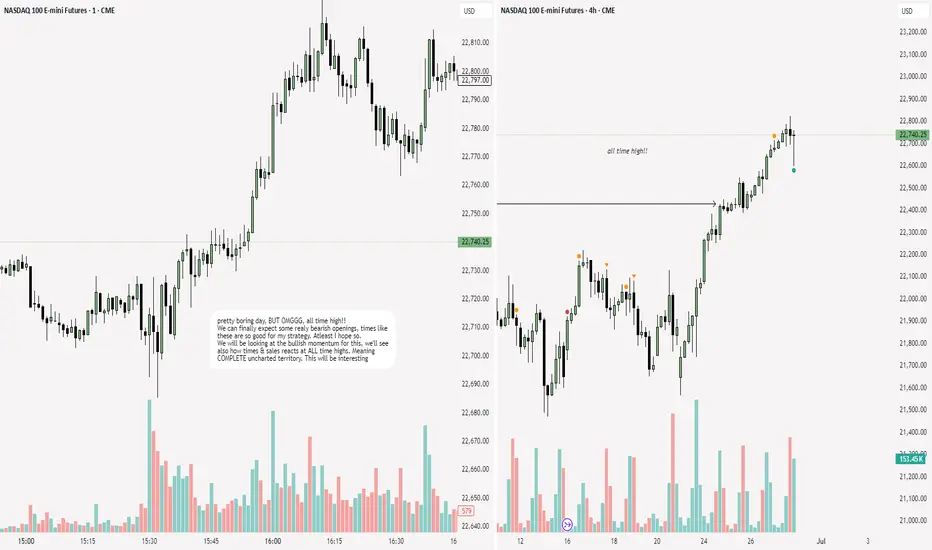
2025-06-30 - priceactiontds - daily update - nasdaqGood Evening and I hope you are well.
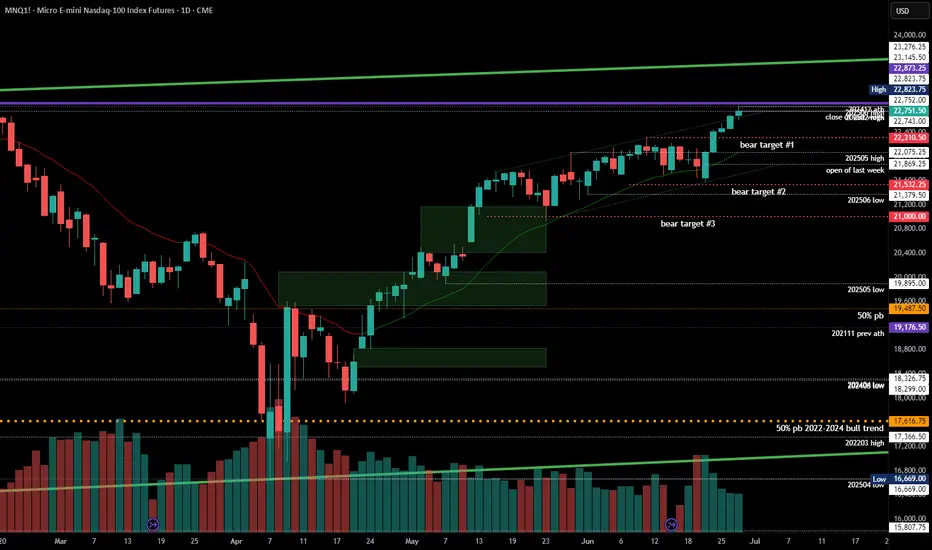
comment: Closing this high at the end of the month is as bullish as it gets. We are close to 23000 that I expect it to get hit. You never know where the top will be, so don’t try to pick it. Market is bullish and bullish only. Even if we print -2% tomorrow, there was no setup and no pattern for you to trade it on. It would be a huge bear surprise and you should never worry about them. Look for the path of least resistance and that is still long. At least for scalps. Bull channel is also still valid until clearly broken, which means a strong print below 22700 would do.
current market cycle: bull trend
key levels: 22600 - 23000
bull case: Bulls want 23000. Market is overbought but that does not matter if we can’t get more selling pressure. Long the pullbacks until it stops working. I can see this going to 23500 but it’s a rough guess and you should not trade based on those.
Invalidation is below 22200.
bear case: Bears got nothing. Don’t look for shorts. Daily close below 22600, then we can start thinking about lower prices again. I still expect this breakout to fail but as of now, we are only going up.
Invalidation is above 23500.
short term: Neutral but I will only scalp long until we see much much bigger selling pressure. 23000 is the obvious target and bears need something below 23700.
medium-long term - Update from 2024-06-29: No change in plans. I expect 20000 to get hit over the next 3 months and maybe 19000 again.
trade of the day: Any long around the high of last week (22823) has been profitable. It was a tight trading range but with a heavy bullish bias going in to today, long scalps were the obvious choice.

NQ: 213th trading session - recapShort today - winning trade. It was pretty lucky, and thats why I gotta focus on breakeven placement. Maybe when price is around my TP area. I don't want a trade that almost hit my TP to go negative, it's the least I can do
Monday hitter NQ1!Hey took a little break but I’m back with the end of the month Monday Mark up. Playing a little safe and marking in up both a buy a sell. As of now there is a head and shoulder developing and I’m looking for it to be a sell. SL is at $250 and I’ve set 4 TP. Good luck and always remember to follow your trading plan and take proper risk management.

Buy limit order post-1H liquidity sweep I’m 1D Timeframe: The daily chart shows a strong bullish trend with consecutive green candles indicating sustained buying pressure. This suggests institutional accumulation and a lack of significant sell-side resistance.
4H Timeframe: The 4-hour chart presents a continuation of the bullish momentum with recent candles forming higher highs. This indicates ongoing institutional demand and a potential preparation for a further push upwards.
1H Timeframe: On the hourly chart, we observe a slight pullback in the form of a small bearish candle. This could represent a minor profit-taking phase or a setup for a liquidity sweep to capture stops below recent lows before continuing the uptrend.
15M Timeframe: The 15-minute chart shows more pronounced pullbacks, yet these are contained within the overall bullish structure observed on higher timeframes. This could be indicative of retail selling or minor institutional rebalancing.
5M and 1M Timeframes: Both these lower timeframes display increased volatility and a sharper pullback. This is typical in lower timeframes where retail trading is more pronounced, and institutional traders may use these moves to engineer liquidity before making significant market moves.
INSTITUTIONAL THESIS:
Institutions appear to be in an accumulation phase, using minor pullbacks to engineer liquidity and trap retail traders on the wrong side of the market. The expectation is for continued upward movement once these phases complete.
LEARNING POINT:
"1H liquidity sweep before continuation of 4H bullish momentum."
SIGNAL: BUY
SYMBOL: NASDAQ 100 E-mini Futures (NQ1!) ENTRY PRICE: $22,850.00 STOP LOSS: $22,800.00 (below the recent minor low to account for any further liquidity sweeps) TARGET PRICE: $23,000.00 (next psychological round number and potential resistance area) CONDITION: Buy limit order post-1H liquidity sweep confirming a bullish continuation on the 15M timeframe. RATIONALE: The setup aligns with a bullish market structure on higher timeframes, a potential liquidity sweep on the 1H chart, and a continuation of buying pressure indicated by the 4H and 1D charts. STRATEGIES USED: 1H Liquidity Sweep, 4H Bullish Continuation URGENCY: MEDIUM TIMEFRAME: Short-term to medium-term CONFIDENCE SCORE: 85% (based on alignment across multiple timeframes and clear bullish signals) RISK/REWARD RATIO: Calculated as follows:
Risk: $22,850.00 (entry) - $22,800.00 (stop) = $50.00
Reward: $23,000.00 (target) - $22,850.00 (entry) = $150.00
Ratio: $150.00 / $50.00 = 3:1
This trade setup offers a favorable risk/reward ratio exceeding the minimum 2:1 threshold, aligning with institutional trading principles and confirming a high-probability entry for a bullish continuation.

NQ1! H1: Sustaining the Uptrend - Support Areas in FocusOverall Trend: The price of NQ1! is clearly in an ascending channel (or parallel channel), signifying a robust uptrend over the observed period. This suggests sustained buying pressure and higher highs and higher lows.
Ascending Channel (Dynamic Support & Resistance):
The lower trendline of the blue channel has consistently acted as dynamic support. Price has repeatedly bounced off this line upon testing it (highlighted by the light blue oval markers), demonstrating strong buying interest at these levels.
The upper trendline of the channel serves as dynamic resistance, defining the upper boundary of the current bullish movement. Price has approached this line but has not yet shown a clear breakout above it.
Support Levels:
22850 to 22860 (1st Supporting Area): This is identified as the most immediate support zone. The current price (22,862.75) is hovering just above or within this area, indicating it's presently being tested as a potential floor.
22800 to 22820 (Intraday Key Level): Located below the first support, this range represents a significant intraday support level. Should the immediate support fail, this zone would likely be the next area where buyers might step in.
22725 to 22750 (1Hr Support): This is a deeper support level on the 1-hour timeframe, strategically placed near the lower bound of the ascending channel after the June 28th pullback. It suggests a strong historical area of demand or price reversal.
Large Green Shaded Area (Lower Left): This extensive green area at the bottom of the chart represents a broader, long-term support or accumulation zone from which the current uptrend appears to have initiated.
Price Action (Candlesticks):
The prevalence of green candlesticks indicates dominant buying momentum.
The significant red candlestick on June 28th shows a sharp intraday pullback, but the long lower wick suggests that buyers rapidly re-entered the market, pushing the price back up from the lower channel boundary. This rebound reinforces the strength of the dynamic support.
In summary, NQ1! in a clear uptrend, guided by an ascending channel, with distinct horizontal support levels identified that align with historical price action and the channel's dynamic support. The current price is testing an immediate support area.
Disclaimer:
The information provided in this chart is for educational and informational purposes only and should not be considered as investment advice. Trading and investing involve substantial risk and are not suitable for every investor. You should carefully consider your financial situation and consult with a financial advisor before making any investment decisions. The creator of this chart does not guarantee any specific outcome or profit and is not responsible for any losses incurred as a result of using this information. Past performance is not indicative of future results. Use this information at your own risk. This chart has been created for my own improvement in Trading and Investment Analysis. Please do your own analysis before any investments.

Prepare for Record-Breaking Momentum- Current Price: $22534.20
- Key Insights: The NASDAQ has been surging to new highs, fueled by strong
contributions from tech leaders such as Nvidia and Meta. While the index
exhibits bullish sentiment, it's hitting overbought conditions, signaling
potential volatility and positioning opportunities for strategic entries on
pullbacks. Seasonal strength could sustain upward movement in the near term.
Long-term investors may consider accumulation near support levels, while
short-term traders should carefully manage risk as the index approaches
resistance.
- Price Targets:
- Next week target 1 (T1): $22,820
- Next week target 2 (T2): $23,100
- Stop level 1 (S1): $22,433
- Stop level 2 (S2): $22,325
- Recent Performance: Over the past week, the NASDAQ gained 4.15%, outperforming
other major indices like the S&P 500 and Dow Jones. It continues to benefit
from strong momentum in mega-cap technology stocks and semiconductors. The
NASDAQ’s leadership has been supported by impressive gains in Nvidia and AI-
driven sectors, reinforcing its tech-heavy advantage. Smaller-cap indices
lagged behind, showing a divergence that could hint at broader market
hesitation or a rotation in leadership.
- Expert Analysis: Analysts highlight the index's technical patterns, including
overbought RSI levels (above 70) and golden crosses in moving averages,
aligning with historical seasonal trends. While bullish sentiment persists,
overbought conditions may lead to short-term pullbacks. Divergences in major
indices suggest caution, especially with weaker momentum among
semiconductors. Long-term optimism remains, provided demand zones hold firm.
- News Impact: Nvidia continues to drive NASDAQ gains, spurred by its leadership
within the AI and semiconductor sectors. Expansion of 0DTE options for
individual mega-cap stocks could increase trading activity, adding both
opportunities and risks. July’s seasonal tailwinds lend support to the
index’s momentum, but traders should remain vigilant for external events or
corrections.
NQ Power Range Report with FIB Ext - 6/30/2025 SessionCME_MINI:NQU2025
- PR High: 22842.50
- PR Low: 22751.50
- NZ Spread: 202.75
Key scheduled economic events:
09:45 | Chicago PMI
Weekend volatility taking auction into new ATHs
Session Open Stats (As of 12:45 AM 6/30)
- Session Open ATR: 345.85
- Volume: 33K
- Open Int: 261K
- Trend Grade: Neutral
- From BA ATH: +0.1% (Rounded)
Key Levels (Rounded - Think of these as ranges)
- Long: 23239
- Mid: 21525
- Short: 20383
Keep in mind this is not speculation or a prediction. Only a report of the Power Range with Fib extensions for target hunting. Do your DD! You determine your risk tolerance. You are fully capable of making your own decisions.
BA: Back Adjusted
BuZ/BeZ: Bull Zone / Bear Zone
NZ: Neutral Zone

Futures watchlist weekending 7-3-2025Here is my breakdown for the futures market week ending 7-3-2025. Not much has shifted from last week, we continue to note the bullish sentiment and look to scalp the pullbacks and load the dips!!!
I also give you a look into our indicator called Futures Pro! We have an awesome library of tools!

NQ: 212th trading session - recapCANT SAY MUCH ABOUT FRIDAY - FRIDAYS ARE HIT OR MISS.
But I'm excited for next week. How we'll play out etc. I won't be trading tuesdays, and probably not wednesdays. I really can't skip class anymore my teacher will notice and make me fail or smth
#202526 - priceactiontds - weekly update - nasdaqGood Evening and I hope you are well.
comment: Similar to dax and for most other markets. Cash index made a new ath and broke strongly above the trading range. This is W5 which I thought was cut short but I guess not. It’s most likely the end of the trend since the trading range went on for about 6 weeks, which in this case was likely the final flag. Futures could now aim to print 23000 and touch the bull trend line which began in 2021 and went though the ath from 2024-12.
current market cycle: resumption of the bull trend but likely the final flag and we most likely will top out here around/under 23000
key levels for next week: 22000 - 23000
bull case: Bulls printed 5 consecutive bull bars. They are in full control and could pump it to 23000. Purely based on momentum and squeezing shorts. Got nothing else for the bulls.
Invalidation is below 21500
bear case: Bears gave up on Monday and I doubt they want to fight this until we hit the bull trend line or 23000. Most bears will wait for a clear topping sign that bulls are beginning to take bigger profits before they think about shorts. As of now, bears have zero arguments on their side. Only a daily close below 22300 would confirm this bull trap and fake breakout above the bull channel and then we could test down to 21900ish but for now I think it’s most likely we go higher.
Invalidation is above 23100
short term: Neutral. Will only scalp longs on huge momentum and I will only start thinking about shorts once we break below 22300 again.
medium-long term - Update from 2024-06-29: No change in plans. I expect 20000 to get hit over the next 3 months and maybe 19000 again.
NASDAQ 100 TECH HEIST: Bullish Loot Before the Bear Trap!🚨 E-MINI NASDAQ 100 HEIST: Tech Rally or Bear Trap? (Thief Trading Blueprint) 🚨
🌟 Hola! Oi! Bonjour! Hallo! Salam! 🌟
Attention all Market Bandits & Tech Raiders! 🏴☠️💻💰
🔥 Thief Trading Intel: We're targeting the E-MINI NASDAQ 100 for a bullish loot grab! Long entry only—high-risk Red Zone ahead: overbought, consolidating, and primed for a reversal. Don’t let the bears ambush your profits!
"Claim your tech treasure and run—you’ve earned this steal!" 💰🚀
🚪 ENTRY: The Tech Vault is Open!
📈 "Swipe bullish loot at any price—the heist is LIVE!"
Buy Limit orders at recent swing lows/highs (15-30 min TF).
📌 Pro Thief Move: SET ALERTS! Don’t miss the breakout.
🛑 STOP LOSS: Escape Plan
📍 Thief SL (Smart Crew): Recent swing low (20,700.00, 4H TF).
📍 Adjust based on your risk, lot size, and orders.
🎯 TARGET: Loot & Exit!
🎯 22,600.00 (or bail early if the market flips!)
⚡ SCALPERS’ QUICK HIT
👀 Long scalps ONLY!
Deep pockets? Raid now.
Light wallet? Join swing traders.
Trailing SL = Your Profit Shield! 🛡️
📢 WHY THIS HEIST? (NASDAQ Bullish Momentum)
Tech rally brewing! Key drivers:
Fundamentals (COT, Macro, Geopolitics)
Sentiment & Intermarket Trends
Index-Specific Analysis & Positioning
🔗 Full intel? Bio linkss checkk! 👉🏻👉🏻👉🏻
⚠️ WARNING: News = Danger Zone! 📡🚨
Tech news moves FAST! Protect your loot:
❌ Avoid new trades during news.
🔒 Trailing SL = Lock profits.
💖 SUPPORT THE TECH HEIST CREW!
💥 SMASH THAT BOOST BUTTON! 💥
More boosts = bigger future heists!
Stronger crew = more $$$ for all!
Profit daily with Thief Trading Style! 📈🏆
Next tech raid coming soon—stay tuned! 🖥️🤑

NQ CHART MY IDEA FOR THE WEEKNot advice this is my idea using diffrent models have a good luck and a good week! CME_MINI:NQ1!

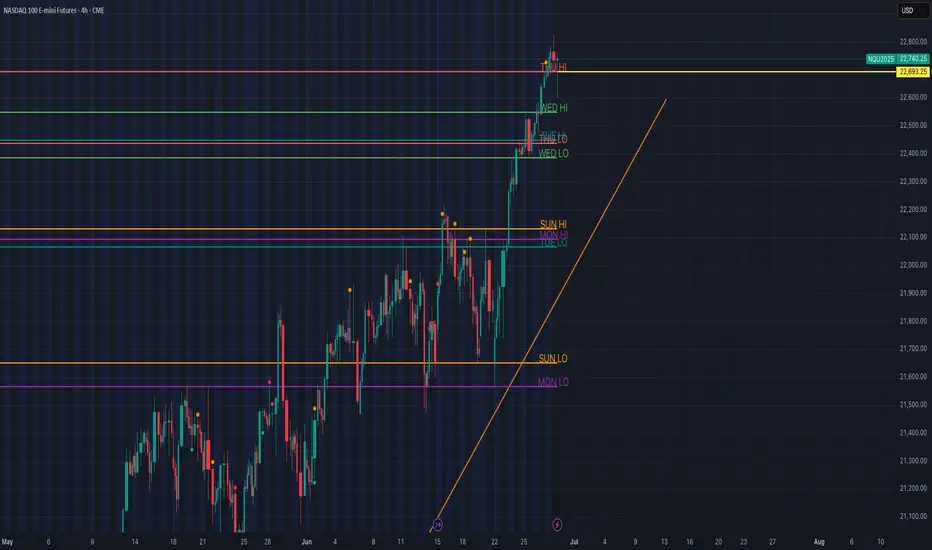
NQ Holding Above Daily Highs – Trend Structure Intact📈 NASDAQ 100 (NQ) – Riding the Trend, Holding Above Key Daily Highs | 4H Chart
NQ remains in a strong uptrend, respecting structure and reclaiming key daily highs going into the final trading days of June.
🔍 Key Observations:
🔼 Price is currently holding above Thursday’s high: 22,740
✅ Strong support formed at Wednesday high: 22,693.25
🔁 Clean reclaim of Tuesday and Wednesday lows — confirming bullish pressure
🔸 Trendline from June 23 low continues to guide the rally
🗓️ Previous Day Levels Providing Structure:
SUN LO / MON LO (~21,550–21,650) → Base of the rally
JUNE 17–21: Price consolidated just below 22,400, forming resistance
JUNE 25: Breakout above Sun/Mon Highs confirmed expansion phase
🧠 Bias & Plan:
Bias: Bullish, as long as price remains above 22,693
🕵️♂️ Watch for reaction around 22,800–22,900 zone (potential exhaustion or continuation)
If we sweep Thursday’s high and shift structure → possible short-term pullback
📌 Summary:
NQ continues to honor the prior week’s highs as new support. The market is trending cleanly with structure, and as long as daily highs hold, the bullish case remains intact.
#NQ100 #NASDAQ #FuturesTrading #SmartMoney #MarketStructure #DailyLevels #PlaymakerTrades