TAOBUSD – Climb Then CoilTAO climbed steadily from the $306 base to nearly $354, with multiple higher lows along the way. Recently, momentum faded and we’re seeing compression around $336–$340. This is a textbook bull trend cooling off. If the price holds above $332 and reclaims $342, LONG setups become attractive. A breakdown below $330 flips the short-term structure to bearish.
TAOBUSD trade ideas

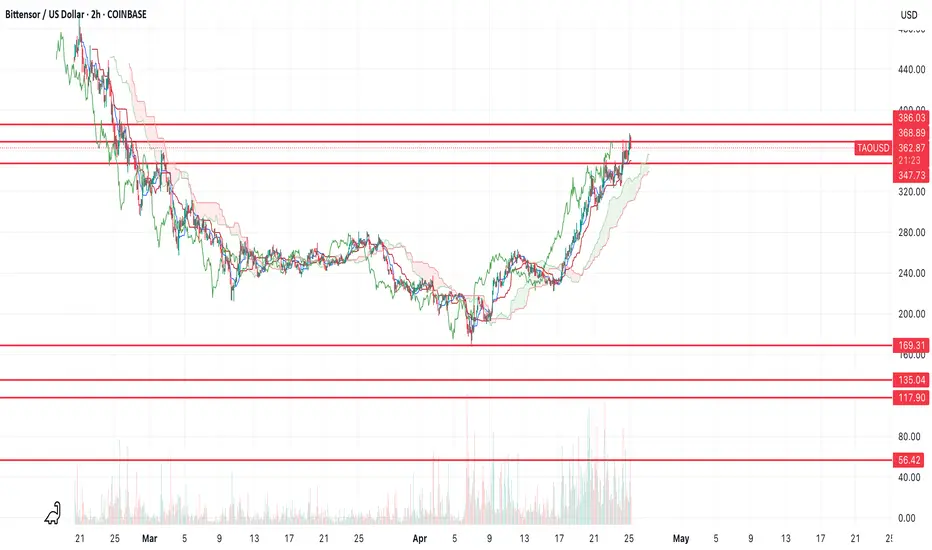
$TAO back to the lows at sub $200 (or lower)Tao looks like it's topping here, I originally thought we'd stop at $247, but price has gone a little bit further. There's more confluence in resistance at this level and one more level above, but I think gains are limited here.
I think it's likely that from here we correct back down to the lows and break them. The most likely target is the $117-135 levels. However, won't rule out the possibility that we find support at the previous low, or that we potentially go lower all the way down to $56.
Let's see how it plays out over the coming weeks.
TAOUSD Breakout and Retest Confirms Bullish StructureTAOUSD has shown strong bullish potential after breakout of two key patterns. The first pattern was a wedge, which formed between May and September 2024. This pattern is typically a bullish reversal signal, and as expected, the breakout led to a strong rally. After reaching new highs, the price then entered a bearish channel, which served as a corrective phase rather than a trend reversal. Recently, TAOUSD successfully breakout of this bearish channel and has now retested the breakout zone around $411, confirming previous resistance as a new support level.
Currently, the $400 – $411 zone acts as a critical support area that needs to hold for further upside continuation. If the price maintains strength above this level, the next key resistance to watch is $480, where previous price rejections occurred. In the medium term, the major bullish target lies at $705 – $730, aligning with a previous major high. From a trading perspective, aggressive entries can be considered around $410 – $420 during this retest, while conservative traders may wait for confirmation with a strong breakout above $480. A stop-loss should ideally be placed below $400, as a breakdown below this level could invalidate the bullish outlook.
For confirmation, volume strength should be monitored, as a breakout with low volume may indicate weakness or a potential fakeout. Additionally, broader market sentiment, particularly Bitcoin’s trend, could influence TAOUSD’s price action.

Trading signal : BITTENSOR ($TAO) - 1D - FALLING WEDGETechnical Analysis:
The price is trading within a Falling Wedge pattern, a formation that typically leads to a bullish breakout. However, confirmation is needed. A breakout above the upper trendline could trigger a rally toward $575 resistance, while a bearish breakdown may lead to further downside toward $300 support.
Momentum indicators remain neutral, with RSI-14 in a balanced range (between 30 and 70), suggesting no extreme overbought or oversold conditions.
Entry Zone:
Bullish Scenario: Enter on a confirmed breakout above the Falling Wedge, targeting $575.
Bearish Scenario: A breakdown below the wedge could push price down to $300.
Targets (Take Profit):
TP1: $575 (+30%).
TP2: $675 (if momentum sustains).
Stop Loss:
Below $290
This notification constitutes a marketing communication. The information provided does not constitute a recommendation, offer, or solicitation to buy or sell any crypto-asset. It is not intended as investment advice, and no consideration has been given to the specific investment objectives, financial situation, or individual needs of any recipient. Any decision to act on the information provided is made at the sole discretion of the recipient. SwissBorg disclaims any liability for losses arising from the use of this material. Recipients should consult their own professional advisors before making investment decisions.

TAOUSD: Bulls Gearing Up or Bears Sneaking In
BINANCE:TAOUSD recently rebounded from the $353 level, a historically significant reaction zone. This level has acted as a pivot for price action, and the recent rebound signals a potential shift in momentum. A breakout above the descending trendline, combined with a candle close beyond the previous swing high, would provide stronger confirmation of a structural change. If this occurs, the next target would likely be the prior highs near $668, representing a significant upside potential.
On the other hand, if the $353 support level fails to hold, the price could decline toward $237. This level has previously demonstrated strong accumulation characteristics, serving as a reliable area for reversals and potential entry points.
The TSI indicator supports the bullish outlook, having broken above its descending trendline and formed a bullish crossover. Although the TSI is still below the zero line, crossing above this threshold would provide additional confirmation of upward momentum. Furthermore, historical data shows that the price tends to rebound when the TSI reaches the -22 level, aligning with the current technical setup.
👨🏻💻💭 What is your take on this TAOUSD analysis? Do you anticipate a bullish breakout, or are you preparing for a dip? Share your insights!
__
The information and publications within the 3Commas TradingView account are not meant to be and do not constitute financial, investment, trading, or other types of advice or recommendations supplied or endorsed by 3Commas and any of the parties acting on behalf of 3Commas, including its employees, contractors, ambassadors, etc.

TAO The new big dog on the block TAO is a beast that has yet to be unleashed.
I have heard rumors of them talking to major players in big tech.
Could this be the next big blockchain ?
Checkout the price targets which are yellow lines, long term take profits.

TAO/USD SHORT. WAITING FOR BUY OPPORTUNITY AT 220 in FEB TAO: Waiting for the opportunity for the right shoulder to close. As of December 18, we are at a price of approximately 500 TAO/USD, and we are anticipating a buying price in the range of 215 TAO/USD. There is a clear and perfect head and shoulders pattern on the weekly chart that is expected by February 2025.
To track this correctly, we need to monitor the breakout of the following Fib resistance levels:
At the 0.5 Fib resistance line (466 TAO/USD)
At the 0.388 Fib resistance line (408.43 TAO/USD)
At the 0.236 Fib resistance line (366.45 TAO/USD)
And reaching the reset line at 0 (220 TAO/USD)
This is not investment advice; it is purely educational and for training purposes.


TAO USD breakdown confirmed. Bad days ahead for BittensorKey support line broken for TAO and onward movement has a lot of thin air from prior rapid price up movement. Good opportunity to short TAO. The only thing that could invalidate it would be big buy-in by whales. If that fails to happen, TAO is likely awaiting a big downward move for the foreseeable future

TAOUSD Technical Analysis Buy Entry BINANCE:TAOUSD
Buy Entry executed on daily chart.
Note: Green Yellow Candle. It is Buy Signal triggered on daily candle close. Following candle is confirmation candle. As it broke the high of Green Yellow Candle enter long with stop loss. Use trailing stop loss to manage your position.

TAOUSDTIn career, we must always chase value and the ability to add value over money. Because eventually, money follows the ability to add value

TAOUSDTIn career, we must always chase value and the ability to add value over money. Because eventually, money follows the ability to add value

The Biggest Market Opportunity?Not many projects in this space that have real exposure to a mega trend and are uniquely positioned to capitalize enormously like this one, I have a feeling in the coming years this will be in the hundreds of billions market cap and only then it will become obvious why.

Too much resistance upwards, lots of interest zones downwardsI was pretty bullish about GETTEX:TAO until I saw the All-time chart, this coin has done 1500% pump already since October 2023..
It's posible that the price keeps going up, yes, but I find it more profitable to buy at lower prices.
Zones of interest for buying GETTEX:TAO :
330 usd
300 usd
220 usd
200 usd
Zones of interest for selling:
450 usd
500 usd
620 usd
750 usd

TAO/USDT: Analysis - will it bit and soar? or bit and sorry?!THIS IS SUPPOSEDLY VIEWABLE FOR ARCHANGELS: NOW PUBLIC.
SUMMARY FOR LAZY READERS:
🚨 Traders, this TAO chart’s a battlefield, and the bears are winning. The 0.618 Fib level’s been snubbed—no bullish bounce in sight. We’re in deep bear territory here.
📉 MAs are out the window; the 50-day and 20-day are being blatantly disregarded. Price action is breaching these with zero respect. It’s bearish, and anyone saying otherwise is selling dreams.
👊 That huge wick? It's a tease, not a trend reversal. Don’t get suckered into bullish traps. This isn’t a buying zone; it's a warning shot.
💥 Sellers, get ready. The 'safe' MAs? They're targets now, not supports. Expect prints at 200MA or 150MA because we might not be done dropping.
#TAO #Crypto #Bearish
See photo for more elaborated explanation.
For more detailed takes. Here is why.
🚨 TAO's chart is in full bear mode, and here's why:
📐 Fibonacci's telling a grim tale. The 0.618 level's been shunned, and when you ignore the golden ratio, you're asking for pain. A false rally to 0.114 was nothing but bears in sheep's clothing, baiting for a drop.
🟡🟣 MAs are crying wolf here—the 50-day (yellow) and 20-day (purple) have been breached with no bounce-back, solidifying the bearish stronghold. Prices slicing through MAs like this? It's not a sign of health.
👀 That wick at the top isn't a bullish battle cry; it's a one-hit wonder. The market's not finding any solid ground, making those 'buying zones' more like quicksand.
🔮 Predictions of a touch on the 200MA or 150MA? It's not just probable; it's like destiny at this point. We're heading south until those levels say 'stop'.
💸 Sentiment's a mixed bag with talk of influencers and VCs pumping. But remember, real markets don't run on hype alone.
In short: Bulls, take a breather; bears, take the wheel. We're not in Kansas anymore, and this yellow brick road's heading straight for a cliff.
#TAO #Crypto #Bearish
