TAO ANALYSIS🔮 #TAO Analysis 💰💰
🌟🚀 As we can see that #TAO is trading in a symmetrical triangle and given a perfect breakout. But there is an instant resistance. If #TAO breaks the resistance 1 then we will see a good bullish move in few days . 🚀🚀
🔖 Current Price: $271
⏳ Target Price: $305
#TAO #Cryptocurrency #DYOR
TAOUSDT trade ideas

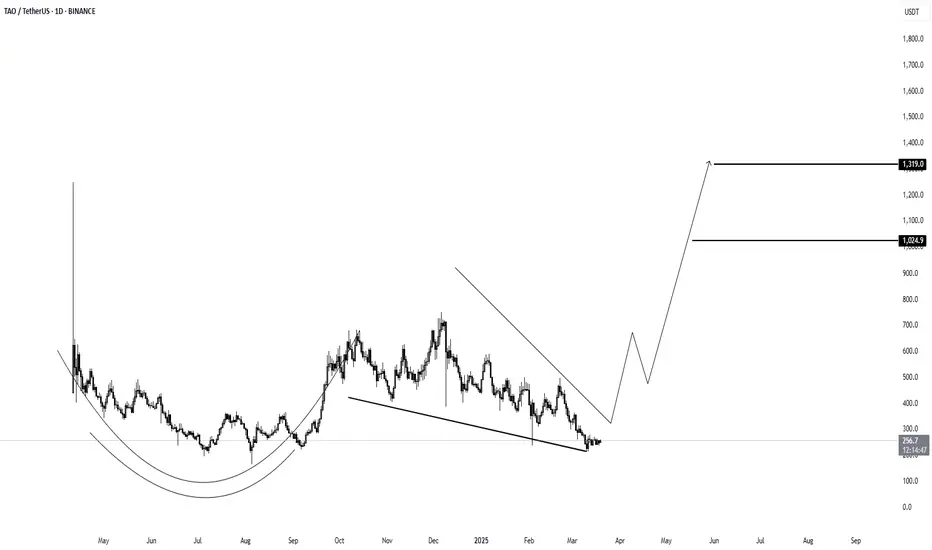
Another $TAO Bittensor tao's Falliing Wedge-Major support RetestGETTEX:TAO Tao Bittensor has formed yet another Falling Wedge
Current price: $243
For everytime #Tao has formed these falling wedges with Key support around 224, It has been accompanied by an explosive move upwards.
#Tao has also lost over 70% of it's value from an all time high of 795. So it is low risk.
Expecting retest of these supports: 370, 578
This idea Invalidation under 224!
More Extensive Analysis:
This chart is showing the price action of GETTEX:TAO (Bittensor) against USDT on a weekly timeframe, traded. Here’s a more extensive analysis based on the provided chart:
1. Falling Wedge Pattern
- The chart highlights a falling wedge pattern, characterized by converging downward-sloping trendlines.
- Falling wedges are typically bullish reversal patterns, meaning a potential breakout to the upside could occur.
- The previous falling wedge led to a strong rally, suggesting a similar scenario might unfold.
2. Current Price & Key Levels
Current Price: $243
Support Levels:
Most recent low $224
Resistance Levels:
$260 - $285** (near-term resistance)
$370 - $380 (tp1 - Take Profit 1)**
$578 - $600 (tp2 - Take Profit 2)**
$794 (long-term resistance)**
3. Key Takeaways & Trade Outlook*
- If the price breaks out above the falling wedge, a bullish move toward $370+ is possible.
- If the price breaks down further, the next major support is around $224.
- Traders might look for **confirmation** of the breakout before entering long positions.

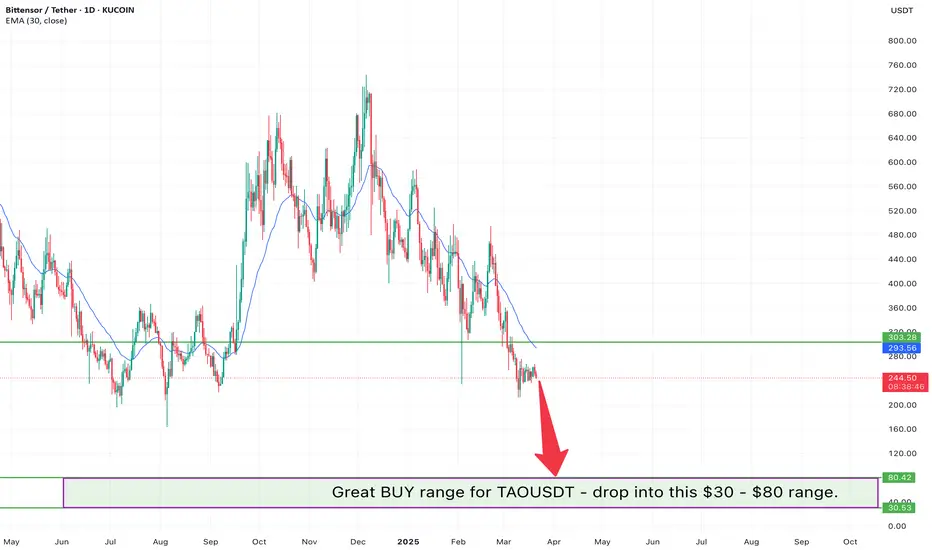
Next buying opportunity setting up on TAOUSDTLooks like price will continue to fall on TAOUSDT -
I feel like the fair market value of TAOUSD is around $303.
Looking for a buying opportunity between $30 - $80 range.
Even though there is a lot of adaption coming out on a global level.
I feel that price will continue to make new lows across the board.
Great buying opportunities in the new future.
bittensor.com

$TAO Let's trap the breakout traders hereOn HTF I'm bullish on this thing but for now it seems like that we can trap the breakout traders before the real breakout.
Hold your horses if you have bought already. For those who want to enter you guys can get a chance.
GL.

Bittensor ($TAO) Analysi
Bittensor, one of the top projects in the AI & DePIN sectors, is currently accumulating above the key zone while still trading below the ATH resistance 🧐
Trend: Bullish reversal in sight
Accumulation: Price is currently at the lower trendline of the falling wedge, indicating a strong buying opportunity.
📌 Best strategy? This is a good opportunity to load a bag of GETTEX:TAO at the current levels!
In the worst-case scenario, I will average my position below the key zone 🚀
Price Targets 🎯
✅ Target 1: $736.7
✅ Target 2: $1,012.9
🚀 A breakout above key resistance could fuel a strong rally to four-digit levels!
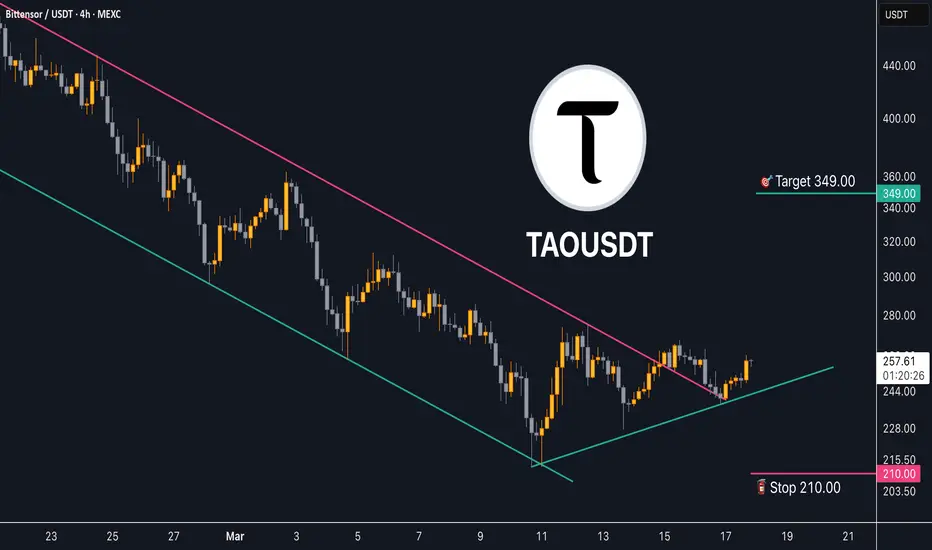
Trading opportunity for TAOUSDTBased on technical factors there is a Buy position in :
📊 TAOUSDT
🔵 Buy Now
🪫Stop loss 210.00
🔋Target 349.00
📏 R/R 1.8
💸RISK : 1%
We hope it is profitable for you ❤️
Please support our activity with your likes👍 and comments📝
TAO Outlook.I think that we take out the liquidity from the downside first. Then we'll enter on a LTF MSB. Aiming for at least a 2R trade setup.
LTF MSB is very important for this setup to play out.

$200 is Key!The $200 level has been a classic support so far, and since January 2024, it has always been the Tao's launchpad. If this level is maintained, we can have a corrective wave towards $350, and if the descending channel is broken, $450 will be accessible. If the $200 level is lost, the first target will be $145, and we will see a 50% fall!

TAO 1H TIMEFRAME UPDATE
This leading AI token innovative a unique model aiming to democratize AI through a peer-to-peer market, which gained significant attention in the wider market
ANY THOUGHTS ON GETTEX:TAO ?
❤️ THIS POST AND I WILL SHARE NEXT pair

TAO - One for the long term I have entered long here,
It's currently holding $100 as a major support. As you can see it retested this level over 6 times and has bounced each of those times.
What the team are building is amazing, I'm a long term holding of GETTEX:TAO and I can honestly see $1k/$2k going into the future.
Are you holding?

TAO ANALYSIS🔮 #TAO Analysis - Breakout 🚀🚀
💲💲 In daily time-frame,Falling Wedge Pattern is forming and a good breakout is done. And a small retest is done, now we would see a good reversal move in #TAO ✅ 💯🚀
💸Current Price -- $249
📈Target Price -- $305
⁉️ What to do?
- We have marked crucial levels in the chart . We can trade according to the chart and make some profits. 🚀💸
#TAO #Cryptocurrency #Breakout #DYOR

TAOUSDT UPDATETAOUSDT is a cryptocurrency trading at $263.8. Its target price is $360.0, indicating a potential 45%+ gain. The pattern is a Bullish Falling Wedge, a reversal pattern signaling a trend change. This pattern suggests the downward trend may be ending. A breakout from the wedge could lead to a strong upward move. The Bullish Falling Wedge is a positive signal, indicating a potential price surge. Investors are optimistic about TAOUSDT's future performance. The current price may be a buying opportunity. Reaching the target price would result in significant returns. TAOUSDT is poised for a potential breakout and substantial gains.

TAOUSDT 3DTAO ~ 3D Analysis
#TAO Buy gradually from here if you still have a Conviction on this coin with a short -term target of at least 20%+.

TAO/USDT – 30-Min Short Trade Setup!📌 📉🚨
🔹 Asset: TAO/USDT (Bittensor / Tether)
🔹 Timeframe: 30-Min Chart
🔹 Setup Type: Bearish Breakdown Trade
📌 Trade Plan (Short Position)
✅ Entry Zone: Below 266.42 (Breakdown Confirmation)
✅ Stop-Loss (SL): Above 268.19 (Invalidation Level)
🎯 Take Profit Targets:
📌 TP1: 262.46 (First Support Level)
📌 TP2: 257.81 (Extended Bearish Move)
📊 Risk-Reward Ratio Calculation
📉 Risk (SL Distance): 268.19 - 266.42 = 1.77 risk per unit
📈 Reward to TP1: 266.42 - 262.46 = 3.96 (1:2.23 R/R)
📈 Reward to TP2: 266.42 - 257.81 = 8.61 (1:4.86 R/R)
🔍 Technical Analysis & Strategy
📌 Bearish Falling Wedge Breakdown: Price is breaking below a key trendline support, confirming a downside move.
📌 Resistance Confirmation: Strong resistance at 268.19, acting as a rejection zone.
📌 Volume Confirmation Needed: Watch for rising sell volume below 266.42 to confirm momentum.
📌 Momentum Shift Expected: Breaking below 266.42 could push price toward 262.46, with a further drop to 257.81.
📊 Key Resistance & Support Levels
🔴 268.19 – Stop-Loss / Resistance Level
🟡 266.42 – Breakdown Level / Short Entry
⚪ 262.46 – First Support / TP1
🟢 257.81 – Final Target / TP2
📉 Trade Execution & Risk Management
📊 Volume Confirmation: Ensure strong selling pressure below 266.42 before entering.
📉 Trailing Stop Strategy: Move SL to entry (266.42) after TP1 (262.46) is hit.
💰 Partial Profit Booking Strategy:
✔ Take 50% profits at 262.46, let the rest run toward 257.81.
✔ Adjust Stop-Loss to Break-even (266.42) after TP1 is hit.
⚠️ Fake Breakdown Risk
❌ If price reclaims 266.42, exit early to avoid a false breakdown.
❌ Wait for a strong bearish candle close before entering aggressively.
🚀 Final Thoughts
✔ Bearish Setup – Breakdown below 266.42 signals potential downside.
✔ Momentum Shift Possible – Watch for volume confirmation.
✔ Risk-Reward Ratio – Favorable 1:4.86 R/R to TP2.
💡 Stick to the plan, manage risk, and trade smart! 📉🔥
🔗 Hashtags for Reach & Engagement:
#TAO #CryptoTrading 📉 #TAOUSDT 📊 #TradingNews 📰 #MarketUpdate 🔥 #Investing 💰 #ShortTrade 🚀 #Crypto 📉 #ProfittoPath 🏆 #SwingTrading 🔄 #DayTrading ⚡ #TechnicalAnalysis 📉 #CryptoSignals 📊 #FinancialFreedom 💡 #MarketTrends 📊 #CryptoAlerts 🔔 #TradeSmart 🤓 #Bearish 📉 #RiskManagement ⚠️ #TradingCommunity 🤝 #SmartTrading 💰 #MarketAnalysis 📊 #TrendBreakdown 🚨
@vibes12

$TAO respecting macro trend line support. Bitsensor ( GETTEX:TAO ) bouncing off macro level trendline support after a 63% drawdown. Possible altcoin season 2.0 on the horizon, so wouldn’t be surprised if this rockets. I don’t hold any GETTEX:TAO , so take that into consideration.

TAO at Strong Suport!TAO has been rejecting the lower bound of its falling channel, marked in blue, which aligns perfectly with the round number $300.
As long as it holds, we will be looking for longs.


TAO Short TradePotential SHORT Trade.
SHORT : 488 - 491
Target : 478 - 475
If the price pumped above 493 ,
Then Target is 457

TAO - Extremely Bullishone of the few coins which are about to go in sub-wave 3 of macro-wave 3
haven't bought this one yet but might rotate a few weak positions to this if the structure holds
no idea what's going to happen to AI tokens (haven't looked into things yet, no time on hand) - sharing this purely based on TA

Textbook falling wedge on TAOEasy and perfect creation on 4h and daily chart
Falling wedge on TAO if it will completes is an easy 100% in a month, otherwise very very easy 10/20%

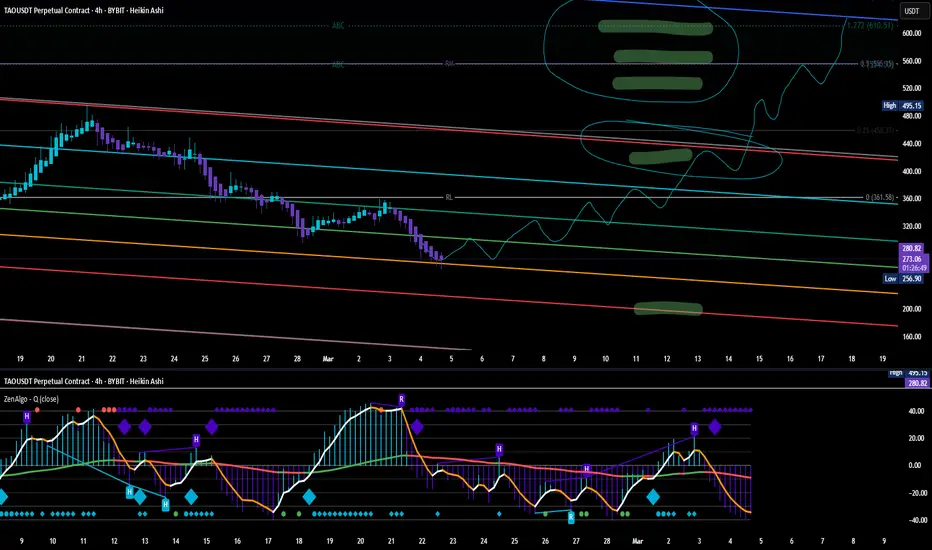
TAO/USDTBittensor ( BYBIT:TAOUSDT.P ) is a decentralized network that merges blockchain technology with AI, enabling a peer-to-peer marketplace for machine learning models. Launched in 2021, TAO has quickly gained traction for its innovative approach. The project operates with a capped supply, ensuring transparency and fair distribution of rewards. As of now, TAO trades at approximately $319, with a market capitalization of $4.09 billion and a circulating supply of 7.38 million tokens.
Bittensor (TAO) is currently trading within a downward channel. Before any potential upward movement, a retest of the $300 level is likely. Once the price reclaims the range, the next target stands at $420, where an unchecked VWAP awaits. The following key technical level is positioned at $520. In green higlited areas are untested VWAP.
On the bottom of chart you see super Q indicator.
Description
ZenAlgo - Q is an oscillator based on the QQE (Quantitative Qualitative Estimation) method. This version incorporates refinements for additional visualization and interpretation options. It is designed to help traders observe momentum changes and divergence patterns in price movements.
TAOUSDT LONG 1H (2Target Done! Congratulation)An excellent situation from the trading plan.
The second goal has been achieved and the stop is at breakeven.
I would like to emphasize that the $320-322 block (break block) confirmed the retention level. You can move the stop order to this level and calmly wait for new variables from the market
UPdate:
1-st target:
