Telcoin Grew 111,943% In 2021: Hidden Gem Part 3Don't believe me? Just look at the chart... I don't think Telcoin (TELUSDT) will grow again like this in 2025 but big growth is still possible. Think of 15X, 20X, 30X and things like that, which can be really great.
➢ 2X is really good. If you buy a pair and it grow 2-3X this is really good.
➢ If a pair you bought grows 5X this is amazing.
➢ When we go beyond 10X that is just absolutely great.
So, we don't need to actually get the full 15, 20 or 30X, what we need is the huge growth potential so that we can secure 3 to 5X easily. Are you following me?
It is easier said than done. Buy low, sell high.
It is easier said than done, being profitable.
And so we look at the chart setups with very low risk with a huge potential for reward with an amazing, long-term strategy.
Even if we make mistakes, we can still come out ahead because, it is easier said than done.
We can talk/write about millions but in truth, most people lose.
Many of the winners tend not to sell.
And many of those that get into the green tend to give it all back through mistakes.
That's why we develop a plan that accounts for all these different situations.
Focus on the long-term.
Buy low and hold.
Let the market grow and sell when prices are high up.
Imagine if the initial bullish breakout produces 300% on the first few weeks, or the first two months, when we are 6 months in you can't go wrong. If total growth potential amounts to 2,000%, as soon as you are 500% in the green you are ahead and even with mistakes we can keep some profits to continue growing and trying again.
It takes time. It takes experience, it takes mental growth.
You see, we have hundreds of these pairs but most people tend to lose, how come? It is all mental as I explained before.
It has to do with your life, with your state of mind, with your health, your dreams, your goals. Depending on what you are thinking, depending on your programming, depending on your beliefs and how much energy you put in, this is what will determine your final result.
How much we can earn depends on how much we want and how much we are willing to accept.
How much we take out depends on how much we can handle.
Can you manage a million dollars?
Can you manage 10 millions?
Can you manage 100 millions?
Ok good... What about those close to you?
If you make it big, don't tell anyone because they might have not gone through the process that you had to go through in order to achieve your goals.
They will be thinking you got lucky... But deep down you know that you earned every single cent through persistence, dedication and hard-work.
Thanks a lot for your continued support.
Namaste.
TELUSDT trade ideas

TELCOIN (TEL) Looks like it's going to drop another 28%. The TELCOIN charts seem to indicate that a drop to the 0.001101 level could be in the cards after just being rejected off a 4H FVG (Fair Value Gap) on the daily chart.
I believe this coin could have a bright future, and being able to buy it at or below the previous low would be a great buying opportunity for those looking to invest for the long term.
Good luck!


$TEL Update with support and resistanceNYSE:TEL Similar to #Bitcoin forming bearish engulfing on current 4H, closely following $BTC. Bullish engulfing on last 1D close but unlikely to follow up due to #Bitcoin 's influence. $0.001572-$0.001543 should hold as key support, Currently struggling to build support at $0.001670. Expect key support test If bearish engulfing on current 4H plays out. Next key areas for support $0.001509, $0.001460, $0.001429, $0.01399 & $0.001347. Resistance areas from here are $0.001776, $0.001830, $0.001971 & $0.002096. Continue watching given S/R areas!

Telcoin (TEL) Targets $0.005 to $0.008 by End of July
Fundamental Overview:
Telcoin is poised for a potential breakout driven by its solid fundamentals. With a fully functional app, regulatory wins, and a robust community, Telcoin has laid a strong foundation for growth. Recent insights from the CEO Paul Neuner suggest a major update is weeks away.
Technical Analysis:
Pattern Recognition: Currently forming a falling wedge pattern, a bullish indicator.
Fibonacci Levels: Price is at the 0.236 Fibonacci retracement level suggesting the retracement is over.
Historical Patterns: Following a similar price action seen during the 2021 bull market.
EMA Support: Price currently finding support below the 200-day Exponential Moving Average.
Chart Patterns: Showing a promising Three Drives pattern.
Long-Term Perspective: It's been 1145 days since its all-time high, down 96.19% with a gain of +2527.17% required to reach ATH.
Sentiment Analysis:
Community Metrics: Significant community growth with 97k followers on X, 18.6k Reddit subscribers, and 14.15k Telegram members.
Social Signals: Increasing Twitter and YouTube interactions and content creator activity.
Market Sentiment: Positive sentiment trend with growing social dominance.
TEL Community Posts
NightDefender2 “The later presence of incoming institutional involvement, would hugely eclipse the current price action estimates. That’s how massive the incoming institutions would affect Tel’s future and yours. Others would label this as hyping, rather I call this plainly, potential.”
CryptoCribz “ NYSE:TEL chart looks way healthier than 90% of the other tokens out there. Hodling up very strong as well.”
SilverBulletBTC “This is a real OG gem. Look at this beautiful setup retesting the 50 weeks moving average”
Additional Insights:
Telcoin app has garnered strong user ratings with 4.7 stars on Apple App Store and 4.6 stars on Google Play, reflecting over 100k downloads.
Recent updates and community growth underline increasing adoption and engagement.
Telcoin's resilience compared to Bitcoin's recent market performance highlights its potential strength.
Conclusion:
Telcoin shows compelling technical patterns and strong fundamental support heading into the bullish market phase. With increasing sentiment and robust community backing, Telcoin is positioned for a potential 100% increase by the end of July.
Disclaimer: This is not financial advice. Always do your own research before making any investment decisions.

TELCOIN is ahead of schedule, targeting $0.35 this cycleTELCOIN ahead of schedule. My 6 month old prediction of $0.23 USD is too low
It is closer to $0.35 now. The increase is based on
growing sentiment on X and more volume from new exchange listings. The CEO has shared new info today that the roll-out of their digital cash solution is around the corner.

$TEL UpdateNYSE:TEL Back to March '24 levels following #BTC drop, currently testing $0.002335 resistance, $0.002256 Key support in effect, next support areas $0.002208, $0.002157, $0.002096 (Key Support), 4H and 1D RSI in oversold region, current 1D following bearish engulfing from previous daily close, $0.002496 support needed to try and regain $0.002620.

$TEL UpdateNYSE:TEL nice climb from $0.003726 support following #BTC, $0.004089 resistance testing as of now. RSI looks good on 4H, Bullish engulfing on previous 1D close with good RSI, if followed thru expect $0.004185 test, next key resistance at $0.004340, $0.003726 remains key support here.

TEL LONGKUCOIN:TELUSDT
This chart tells us it's very bullish. Our stop is below 0.0032 in case of 4-hour candlestick closing. Target 0.0048 Good luck

TEL - A long term spot trade opportunity$BINANCE:TELUSDT (1W CHART) Technical Analysis Update
TEL is currently trading at $0.003958 and showing overall bullish sentiment. We are seeing the price breaking out from the resistance level and retraced back to the support (previous resistance) Im expecting a continued bullish trend and we have a huge potential for profits. We enter a the trade in spot market
Entry level: $ 0.003958 or lower
Stop Loss Level: $0.002214
TakeProfit 1: $ 0.004624
TakeProfit 2: $ 0.005959
TakeProfit 3: $ 0.008971
TakeProfit 4: $ 0.012754
TakeProfit 5: $ 0.024541
TakeProfit 6: $ 0.035754
TakeProfit 7: $ 0.049193
Max Leverage: spot market
Position Size: 1% of capital
Don't forget to keep stop loss.
Follow Our TradingView Account for More Technical Analysis Updates, | Like, Share and Comment Your thoughts.
Cheers
GreenCrypto

Telcoin [TEL] Technical Analysis Chart ideaTelcoin Breakout from falling wadge pattern, one day Chart point at target 300% long term
Telcoin Uses blockchain for transformative remittance services, reducing global wealth disparities. and its base on the Ethereum blockchain that will be distributed by your national telecom operator made available to everyone, anytime, anywhere.

$TEL UpdateNYSE:TEL on $0.002732-$0.002687 support, RSI on 1D and 4H weak, $0.002952 initial resistance from here, next support area around $0.002620-$0.002496. $0.003254 key resistance from here. Needs #BTC to push, watch given S/R

prision breakIn the weekly time, we see a beautiful departure from the green pattern from the first red resistance and a 170% growth and hitting the second red resistance.
Now, a possible pullback to the first red point can happen, or
we can see the next good growth by firmly crossing the second red resistance.
wait & watch it.

$TEL UpdateNYSE:TEL pretty similar to CRYPTOCAP:BTC , closely following #Bitcoin, $0.003915 testing, current support at $0.003642. Bullish engulfing on last 1D close but looks completely dependent on CRYPTOCAP:BTC as of now to expect a follow up. $0.004580 support needed to reattempt at $0.005607, expect good resistance from $0.004580 unless CRYPTOCAP:BTC went nuts. $0.003472 key support here.


$Telcoin -Still AliveIt always look impossible until it happens.
Have always believed in this project and so have been providing liquidity on TELX the past 3 years..
Lets see how that pays off soon
It just made its first major breakout in a year and 3 months

$TEL UpdateNYSE:TEL beautifully gained support of $0.001459, currently moving to reattempt at $0.001543, possible bullish engulfing on current 4h similar to CRYPTOCAP:BTC , should be able to take $0.001572 easily breaking out from here if the bullish engulfing played out, RSI on 1D and 4H looking good, Next key resistance at $0.001619 which will require $0.001572 support. Current key support at $0.001399.

Inverse Chart of TEL "Massive Dump Inbound" | Mid Term (12HR)Inverse Chart of KUCOIN:TELUSDT "Massive Dump Inbound" | Mid Term (12HR)
- Accumulating small and micro cap ALTs to hedge against market correction/pullback period to begin in earnest within the next 30 days and lasting up to and through the BTC halving event in April
- KUCOIN:VELOUSDT KUCOIN:VRAUSDT KUCOIN:TELUSDT BITTREX:BAXUSDT KUCOIN:BLOKUSDT are some of my main picks, in order of preference, all of which with massive profit potential within the next 90 days
- With any luck, these small/micro cap ALTs will run over the next 75 days, while BTC and the rest of the broader market top 100-200 ALTs by market cap take a nose dive into the dirt and cool down for a while
- End result, flush with profits from small/micro cap plays, at time when my primary investment interest coins like OKX:CSPRUSDT and BINANCE:XRPUSDT are at discount prices, for the last time, before the Crypto bull market starts in earnest
Personal Approach & Base Chart Setup
- Stacked Parallel Channels for Grid of Confluence Points
- High Time Frame (HTF) Fib Extensions, Retracements, & Time Cycles
- Red Filled Horizontal Rectangles between areas of major Fib level from Extensions and Retracements
- Teal Filled Horizontal Rectangles are areas of major support and price points for further DCA long order accumulation
- Price Label Callout with Red Circle highlighting points of interest where I'd consider making a trade
- I will consistently monitor and adjust taking into consideration long/mid/near term price action and market conditions/news
Additional Remarks
Something I like to do to give myself some valuable perspective when looking to invest/trade for after I've mocked up HTF price action and possible movements with fibs, parallel channels, and fractals, is to then inverse the chart (Keyboard Shortcut ALT + I), and zoom out... Sometimes just seeing things from an alternate perspective, can give you that last little bit of confidence needed.

Mock Up Price Action for TEL | Mid-Long Term (12HR)Mock Up Price Action for KUCOIN:TELUSDT | Mid-Long Term (12HR)
- Accumulating small and micro cap ALTs to hedge against market correction/pullback period to begin in earnest within the next 30 days
- BYBIT:VELOUSDT BITTREX:BAXUSDT KUCOIN:VRAUSDT BITGET:BLOKUSDT are my main picks
Personal Approach & Base Chart Setup
- Stacked Parallel Channels for Grid of Confluence Points
- High Time Frame (HTF) Fib Extensions, Retracements, & Time Cycles
- Red Filled Horizontal Rectangles between areas of major Fib level from Extensions and Retracements
- Price Label Callout with Red Circle highlighting points of interest where I'd consider making a trade
- I will consistently monitor and adjust taking into consideration long/mid/near term price action and market conditions/news

$TEL one last dipPA is currently trading in a descending wedge, based off my analysis i believe we will see one more dip before PA starts breaking above major trend. Keep an eye on the .786

$TEL UpdateNYSE:TEL Broke $0.002335 support turned resistance, $0.002156 support in effect as of now. Previous daily closed very poorly with bearish pin bar, Could put bullish engulfing on current daily. RSI looks good, $0.002335 support required.

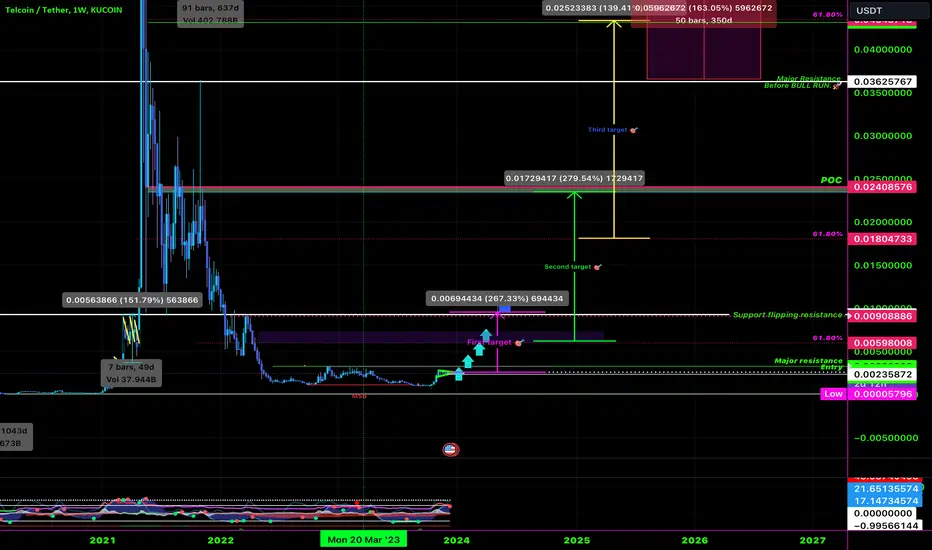
Telcoin Price analysis. December 2023, santa rally.Hi guys, I know we have been in a rather frustrating holding pattern for a few days/weeks on NYSE:TEL , but I wanted to layout my slightly longer term thoughts on the technicals into next year. I believe these technicals, combined with every increasingly positive fundamentals, suggest an explosive move to the upside is indeed imminent. I know it gets tiring and emotionally draining when this coin tests your patience and you see other Alts flying, but hopefully this analysis can give you some comfort and keep your mind at ease that we will indeed, in my strong opinion, have a wonderful Christmas and 2024-2025 holding on to our dear $Tel.
This chart shows my near-mid-long term targets. Please let me know your thoughts.
*Major first resistance to watch - 0.0059 - 0.009259
*Second major resistance to watch - 0.018 - 0.024
*Third major resistance to watch - 0.030 - 0.043
Beyond that, biggest bull run yet to come (ultimate price discovery above 10 cents in my humble opinion)
Wishing everyone a wonderful festive season.