Telcoin Weekly Analysis to $0.50Telcoin Analysis by CryptoMitchX
Disclaimer: This is not financial advice, this is just my interpretation of the chart data.
Weekly Chart Analysis
The Bull Market started for Telcoin on the 16th of October 2023. That is when it broke out of the 125-week (875 days) long downtrend.
Using the Visual Range Volume Profile (VRVP) we can see the following (in order of most to least relevant):
Previous VOLUME HOT ZONE
The point of control from November 2023 to now is $0.00237
$0.0015 is a significant level with strong volume going back to Dec 2021. This support level should be on your charts. It remains the strongest level even in July 2022.
There was a lot of historical volume between the $0.003 support and the $0.00015 support. I am 99% sure we won’t ever touch the $0.0003 support ever again.
Upcoming VOLUME HOT ZONES
$0.004 to 0.007 has quite a bit of build-up of volume.
$0.018 does too
$0.034 does too
How do we predict the price discovery?
I’m going to do it two ways. One way is using the previous bar patterns, and the other is by drawing it on the chart myself assuming the next 18 months will be a bull market with the Bitcoin Halving and the introduction of the 11+ Bitcoin ETFs. These are all estimates. I’m not willing to do technical analysis above $0.50 because it becomes incredibly inaccurate, however, it is theoretically possible Telcoin could hit $10 I don’t know how high it will go, so I can’t comment on that.
Slow Way:
Weekly Bar Pattern Analysis
One option to read price discovery
Disclaimer: This is not financial advice, this is just my interpretation of the chart data.
If we grab the bar pattern for the price action for the date range 30 March 2020 to 10 May 2021. Then over lay that on the current price starting at 16th of October as the repeat of late March 2020. Then we get the following results.
Note: This is objective data not subjective opinion.
Note: My lower target for the bull run remains unchanged at $0.23 USD.
Estimated Dates and Prices:
Feb 2024: Price at $0.0015 support
March 2024: Price at $0.0038
August 2024: Price at $0.007
September 2024: Price at $0.035
Early November 2024: $0.065
Late November 2024: $0.23 (parabolic end)
Fast Option
This is more likely because of the Fundamental changes since the last bull run. Telcoin progress and adoption + Bitcoin ETF macro-fundamentals.
This is hand-drawn so less accurate. However, I am taking into consideration the fact that this bull market has more participants in it, Telcoin has better fundamentals, and the inflow of capital will be huge. I’m also using the support and resistance levels and Volume Profile information to show me where the pumps and pullbacks might be.
It is not wise to estimate price direction past 50 cents as that is already a lot of speculation.
Estimated Dates and Prices
Jan 2024: $0.007
April 2024: $0.0018
July 2024: $0.03 - 0.04
August 2024: $0.065 (this date feels late to me)
October 2024: $0.23 (this feels about right)
Feb 2025: $0.50 (this is hard to predict accurately, but giving my best shot at it)
I will do a short-term chart soon because if I add that info to this chart it won’t look as clean.
Disclaimer: This is not financial advice, this is just my interpretation of the chart data. I'm trying to do the best I can for the Telcoin community.
TELUSDT trade ideas

$TEL Update (Bullish Pennant)NYSE:TEL key support at $0.002496 in effect, very poor 4H close following CRYPTOCAP:BTC here, Bearish daily close, bullish pennant forming here range narrowing down, but this will become ineffective if CRYPTOCAP:BTC slips, let's see if plays out, $0.002951 test will be likely if played out.

TEL- Hasn't even started. Hi,
An amazing company that has been building throughout the bear market. Can easily hit new highs during the next cycle.
Long term target would be the fIb level at 0.27c.

$TEL UpdateNYSE:TEL all hyped up as CRYPTOCAP:BTC tests key resistance area $37,499, second attempt at $0.002830 resistance, 1D closed super bullish with bullish engulfing same as #BTC, $0.002734 support not tested, current support at $0.002686, next resistance at $0.002951

Telcoin to 0.003 by November 18thTelcoin (TEL) Chart Analysis - Potential 25% Move by 18th November!
Overview:
Telcoin (TEL) has been exhibiting a strong upward trend recently, and it's worth keeping an eye on a potential price target in the near term.
Key Points:
Upward Trend: Telcoin has been on a solid upward trajectory in the past weeks, indicating bullish momentum.
Recent Pump: The recent surge in buying volume and price suggests renewed interest in TEL.
Price Projection: Based on the current trend, there's a possibility of Telcoin reaching the $0.003 mark by 18th November. This represents a potential 25% move from the current levels.

$TEL UpdateNYSE:TEL Consolidating here ranging $0.002096-$0.002256, $0.002096 key support here, last 1D close looking good, Weekly close super bullish, revisiting current key resistance area $0.002256 first time since april. Taking $0.002256 will bring $0.002409 test

Telcoin targeting $0.0029 on its next rally upTelcoin is creating one of its famous Bull Flags and is targeting $0.0029 on it's next rally.

Telcoin is Bullish and moving very nicely on the 1 hour chartTelcoin 1HR Chart
The long upper wick is usually bearish.
However, it comes after a large green candle.
I don't see it as bearish but as taking a breath.
The MACD is bullish. No sign of slowing down.
Volume is a little hard to read on this time frame right now.
RSI is bullish.
The supertrend indicator is giving a BUY signal.
Breaking through $0.0022 means $0.0029 will come soon.
I'm not trading based on the hourly. I've got a much longer time horizon in mind. But it is great to see the shorter time frames supporting that narrative.

Telcoin Price targets this bull run 23, 35 and 50 cents.TELCOIN PRICE TARGETS
Assuming the bull market has already begun. 23 cents per TEL would be a repeat of the last bull run
Estimated by March 24th.
However, I could see it hitting $0.35-49 later in the year.

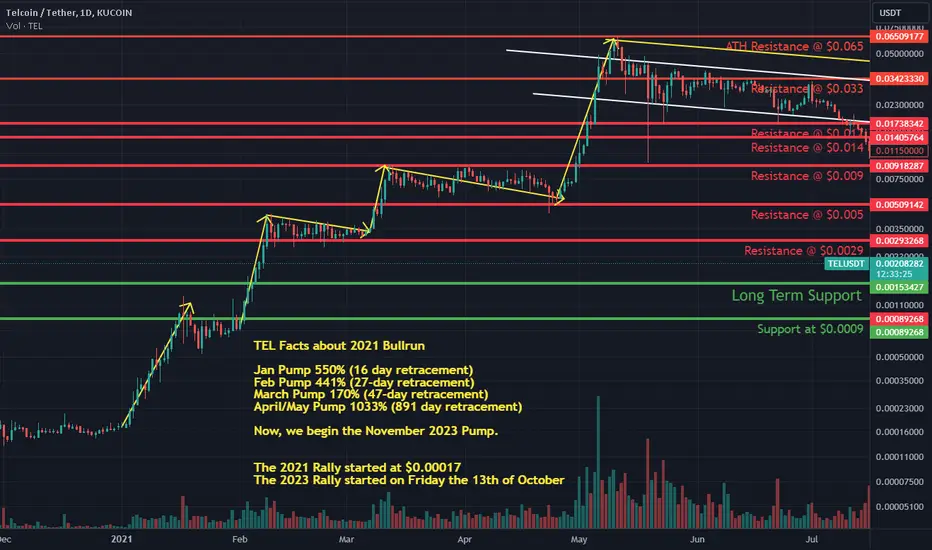
Learning from Telcoin's past to predict the future.TEL Facts about 2021 Bullrun
Jan Pump 550% (16 day retracement)
Feb Pump 441% (27-day retracement)
March Pump 170% (47-day retracement)
April/May Pump 1033% (891 day retracement)
Now, we begin the November 2023 Pump.
The 2021 Rally started at $0.00017
The 2023 Rally began on Friday the 13th of October
I'll be doing my ATH target predictions soon.
Telcoin Technical and Fundamental Analysis November 4thTelcoin Analysis
Fundamentals
Telcoin is a decentralized financial technology platform focused on blockchain-powered mobile financial services.
It has added 82 new cryptocurrencies to its platform, bringing the total number of DeFi assets to 110.
The Telcoin App enables users to store, send, and trade these cryptocurrencies, especially those native to the Polygon Network, offering faster and more affordable transactions.
User Experience Improvements:
Version 3.7 of the Telcoin App introduces a fresh UI/UX with Market View, providing live price updates for all digital assets.
The app also includes a new bottom navigation bar for easy access to Wallet, Trade, Market View, and Account screens.
Users can easily deposit tokens from external accounts into their Telcoin App using a personal wallet address and Deposit QR code.
Geographic Expansion:
Telcoin users in the United States can deposit USDC with a debit card, with plans for bank deposits and withdrawals.
European users in several countries can also deposit USDC into the app and withdraw Euros via SEPA transfer, with plans to expand further in the European Union.
Regulatory Compliance:
Telcoin emphasizes DeFi, an assisted self-custody model, and compliance in the markets it operates in.
It has taken steps to support state-chartered banks in creating digital asset depository institutions.
Recent Price Activity:
Telcoin (TEL) has experienced significant price movements, including a 44.12% increase against the US Dollar in a single day.
TEL's trading volume surged, with most trading occurring on KuCoin's TEL/USDT pair.
Sentiment
Bitcoin Fear and Greed: 65 Greed
The Telfam community on X is active and highly engaged.
The Telcoin community anticipates further bullish price activity.
Technicals
Telcoin has broken out above the downward channel that started in May 2021
MACD is bullish on longer time frames.
Broke through the long-term support of 0.0015, which was the same breakout zone in the last bull run of 2021
Monthly Chart
The first green MACD Histogram bar since December 2021 shows a considerable reversal to the upside.
MACD Bullish Cross happened at the close of last month's candle
Monthly volume decreased, showing a turnaround as the volume was sell pressure.
RSI is at 40, which shows TEL at these prices is unvalued in the long term.
OBV has a long way to go upwards. But we’re seeing positive signs of an increase in volume. This is the real opportunity because everyone else hasn’t jumped into it yet.
Daily Chart
MACD is Bullish 21 days in a row now.
50 MA and 200 MA heading towards a golden cross.
Daily volume increasing.
Continuation patterns appear in candlestick patterns.
The last 4 daily candles prove to be a bull flag.
RSI is in overbought territory at 75, which shows bullishness when balanced with all of the other factors.
OBV volume is picking up significantly on the daily. Showing recent interest increasing
.
Support Levels
$0.0009
$0.0015
Resistance Levels on the way to ATH
$0.0029
$0.005
$0.009
$0.014
$0.017
$0.033
$0.065

✴️ Telcoin 1,200% Bullish Wave (The Key To Success)Telcoin (TELUSD) has been crashing (a correction) since May 2021, which is more than two years and a half, this is a long-term in Crypto.
Cryptocurrency cycles tend to develop within 2 years.
➖ Within two years a bull-market develops.
➖ Within two years a bear-market develops.
➖ Within a four years cycle we get a bull and bear market.
Back to Telcoin.
After such a long correction, we can expect a bullish wave to show up, even if just a small one.
There are technical signals supporting this statement of course but we will forget about those.
👉 Easy potential can go to 450%.
👉 Still easy is 1,200% potential growth for this pair.
Remember, things can always change.
If you decide to use a stop-loss or not it is up to you...
If it crashes, are you ready to wait?
If it goes up, when will you sell and buy how much?
If it crashes and you plan to get out, when will you do so?
Will you stop the trade at 10% red, 20% red or hold long-term?
Answer these questions beforehand and eliminate all trading related stress.
Very easy... Write it down.
Only take action based on what you wrote when relaxed and sober.
No alcohol, no drugs.
Exercises, clean food, meditation, supplements, deep breathing and success is yours.
Namaste.

TEL showing a very impressive investment opportunityHi Everyone;
today we have one of the best risk to reward Investment opportunity
it is more than 4400 times the risk and the chart is look very promising.
I expect breaking the previous bear market key point will clear the way to the final target

TEL 12H ( Bullish Scenario ) In the 12-hour time frame, 3D Pattern is forming, and at the same time we see compression below the $0.00162539 resistance, which can expect the completion of 3D Pattern .


Dump itGarbage, garbage, garbage, garbage, garbage like shiba inu and feg token....lies and garbage...pump and dump, you'll never change my mind! Join @LisaNEdwards for real signals!!!

$TEL Mid to Long term Swing Trade LONGTEL fell perfectly forming a bottom structure at the golden ratio, I personally waited for a breakout to form a higher high and then a retest before entry. Would be great to get some of the Volume we had on the previous bull run, will be watching BTC.D Closely for next few weeks to see how this affects the price action.
I used the trend based fib extension tool to highlight the first 2 targets (grey boxes) which has some nice confluence with previous resistance levels on both weekly and daily charts.
I use the Volume profile indicator on the daily chart on confluence for the Entry as we have massive vol BYBIT:TELUSDT KUCOIN:TELBTC ume around the entry point and higher probability this will hold looking at the current market strength.

Telcoin - Long+/-35% up in 3 days and counting.
For now I would say a symmetrical triangle (previous chart can still be in play).
Dyor

TEL/USDTTEL looks bearish to me at the moment, I have put an alert on green line if it comes down there I could consider taking a position otherwise Im not interested

Telcoin 200%? If #Telcoin can break resistance at the 0.0037 level we could see a 200% plus anywhere between 0.009 and 0.01
Failing to break resistance we could come back down to 0.00195


Telcoin - LongMade some new adjustments. I personally think that we will see some nice movements upcoming months.
Of course I can be wrong. Dyor

✴️ Telcoin 490% Potential Mapped, Full Analysis!One of our followers asked for Telcoin just a few days ago but, will he find this trade idea?
Maybe... Here is the analysis as requested.
Telcoin (TELUSDT) hit bottom in September 2022 much earlier than other altcoins. The initial wave took place from this Sept. low until early December when a strong correction took place.
4 Red consecutive weeks... Correction time comes fast and strong, and as support was found, we are now seeing TELUSDT move weekly above EMA10/EMA21 and consolidating above these levels.
So we have a strong higher low in late December and the entire month of January as consolidation.
With the RSI above 50, all these signals lean bullish.
As usual we compare altcoin vs altcoin, market vs market, here we see TELUSDT below EMA50 and we are calling this "early" yet it has been growing for more than 4 months.
We can expect to see a jump on the next breakout to 0.003730 first, followed by 0.005250 easy.
The main target is always the Fib. golden ratio, in this case 0.006230.
The blue dashed lines and light blue space denotes support/stop-loss. We have a short-term support and a long-term one.
How you use this information is completely up to you, but I wish you the best of luck and great success.
I am wishing you abundance, wealth and happiness.
I am sending you my deepest gratitude for your support.
Be strong.
Stay safe.
Namaste.
