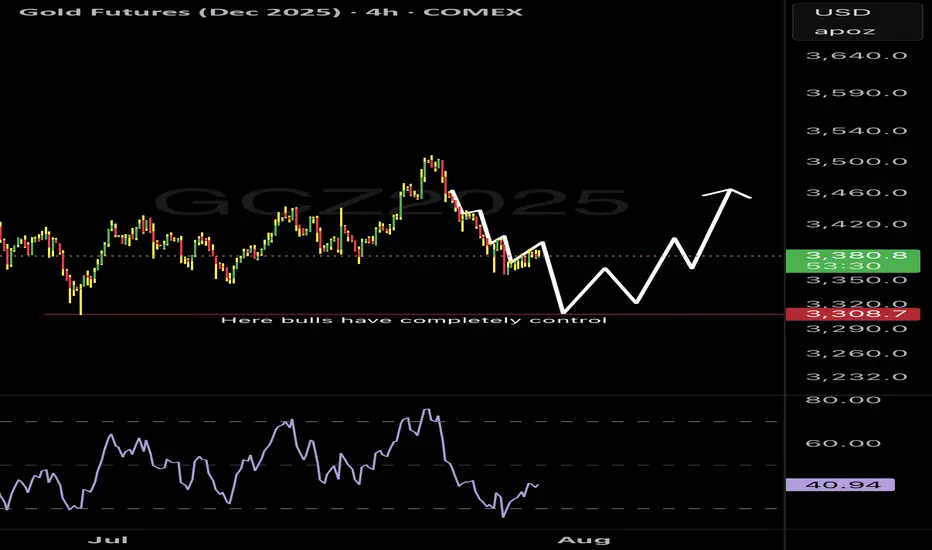
MGC Bear Flag or Dead Cat Bounce? Tokyo’s About to DecideClean structure forming on MGC after a heavy impulse sell during NY session. We’re now consolidating below VWAP in what looks like a textbook bear flag or descending wedge.
We had a sharp breakdown from the highs with no real attempt to reclaim the structure. Price is now compressing underneath the 9/21 EMAs and VWAP clear bear pressure. Volume POC from this range is sitting around 3,332.7, and price can’t even sniff it. Fibonacci 50% retrace off the sell leg aligns with POC stacked resistance.
Entry marked at 3,318.4, targeting a breakdown into 3,268.4 roughly the measured move from the flag.
Quant Confluence:
- Under VWAP
- Below 9 & 21 EMA
- Fib 50% rejection
- Bear flag structure
- POC rejection zone
If I'm Wrong:
If price closes above 3,332.7 (POC) or breaks and holds above VWAP, the bear thesis weakens significantly. Flip long only on a full structure reclaim.
GF1! trade ideas

Gold Holds Trendline Amid Rising MomentumFenzoFx—Gold remains above the ascending trendline, trading around $3,386.0. Technical indicators like RSI 14 and Stochastic show rising momentum, reinforcing the bullish bias.
Immediate support lies at $3,347.0. If this holds, XAU/USD may climb toward the monthly VWAP at $3,412.0.
The bullish outlook is invalidated if Gold closes below $3,347.0, which opens the door for further downside toward the next support at $3,307.7.

Gold loading up on buys but first, more drops!Gold is in a place where many are loading up on buys and I understand why. Gold has been taking some significant drops since pushing all time highs but check my charts and reason with me.
In the large timeframes gold still has some movement down to complete the cycle before going back for all time highs again.
Additionally it’s holding the $3388 resistance level (futures price) pretty strong on the 15 minute chart. It’s gonna be an interesting week for gold to say the least.
Gold Contract Rolled!Now that the contract rolled We might get a bit more movement. Yesterday was nothing but a giant flag. I want to see price go sweep levels before turning full on bullish. We must keep in mind that we are at the end of the month as well. so price can end up stalling till next week. but tomorrow there is a lot of News pending. So that can really shake things up.

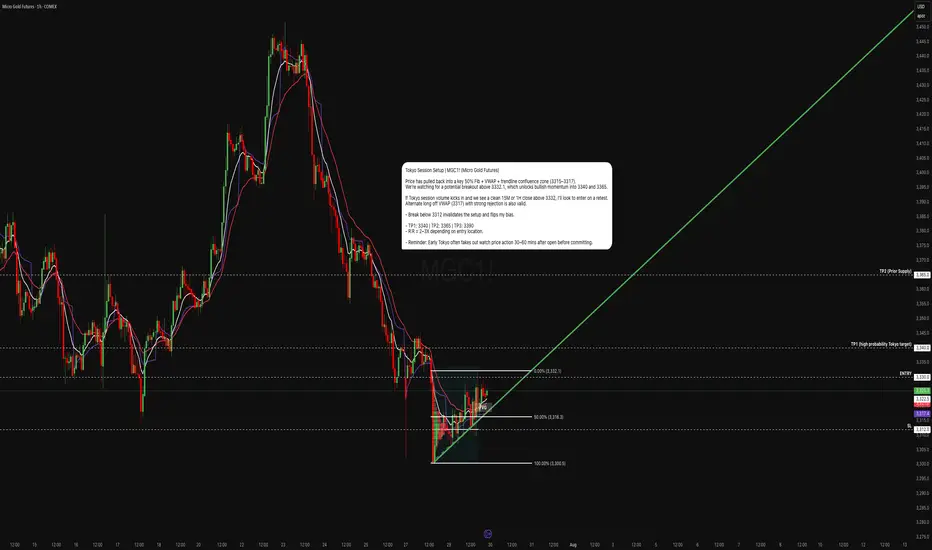
Gold’s in the Chop Shop. Tokyo’s Got the KeysGold has entered a key decision zone ahead of Tokyo. After a controlled retracement off the 3332 swing high, price has now compressed into a high-probability confluence pocket:
- 50% Fibonacci retracement (3316.3)
- VWAP acting as dynamic support (~3317)
- Trend line support holding from prior structure lows
- Compression below 3332.1 the breakout gate
If Tokyo volume engages, this could trigger a clean structural breakout into higher liquidity zones.
Primary Entry:
- Trigger: 15M or 1H candle close above 3332.1
- Entry Range: 3333.0 – 3334.5 on retest confirmation
- Stop Loss: 3312 (below trend line + VWAP)
Aggressive Entry (Mean Reversion):
- Bounce off VWAP/Fib zone (3316–3317.5) with bullish reaction
- Tighter SL: 3312–3314
- Lower R:R, but better pricing
Target Zones:
- TP1 3340 Minor resistance & round number
- TP2 3365 Prior breakdown zone / supply
- TP3 3390–3400 Extended Tokyo move + trend reversal territory
If I'm Wrong:
A breakdown below 3312 invalidates the bullish thesis. That would signal VWAP failure, trend line break, and potential reversion to 3300 or lower.
Technical Confluence Checklist:
- VWAP support holding - Complete
- 50% Fib bounce attempt - Complete
- EMAs compressing for potential crossover - Complete
- Clean trend line structure intact - Complete
- Low volume chop zone between 3312–3332 - Caution
Tokyo often fakes the initial move. Ideal trigger confirmation comes 30–60 mins after Tokyo open, once liquidity builds. Watch for manipulation wicks around VWAP before committing.
This is a classic quant compression setup, price is coiled into structure, and all major intraday tools align. If we see a clean move above 3332 with volume, the breakout could unfold fast. But lose VWAP and trend line, and the bias flips instantly.
Stay reactive, not predictive. Let price prove direction.
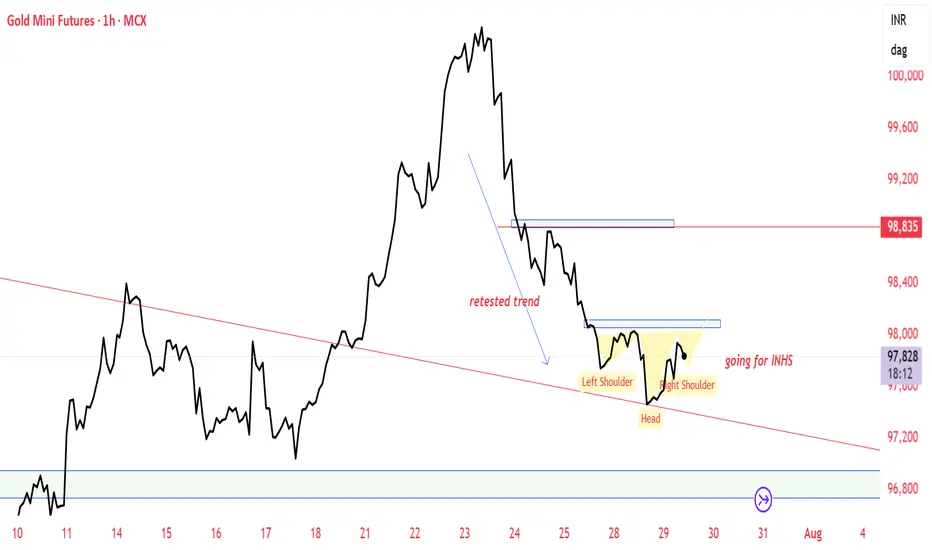
GOLD MCX BULLISH VIEWAfter 4 days continuous down side Some pullback relief expected till 99000. Tested trendline near support zone of 96900 and supply zone near 98200-98500-99000
Please do your own research before taking any trading decisions

Gold Update 28 JULY 2025: On The EdgeGold is accurately following the path shown in my earlier post.
Wave D respects the triangle rules, staying below the top of wave B.
Wave E appears nearly complete, even piercing the A–C support line.
This is acceptable as long as wave E stays above the wave C low at $3,251.
Keep a close eye on this invalidation point.
The target range remains unchanged: $3,900–$4,300.

Gold: $3,348.0 Resistance in Focus for BullsFenzoFx—Gold's decline reached the ascending trendline near $3,314.0. The bullish trend remains intact while price holds above the trendline.
Immediate resistance is $3,348.0, and a close above this level could lift the market toward $3,389.0 and potentially $3,451.0, aligning with recent higher-lows.

mcx future gold price moving we are prepare technical chart upcoming price expected down 98100 R
97890, 97690, EXPECTED S1 & S2
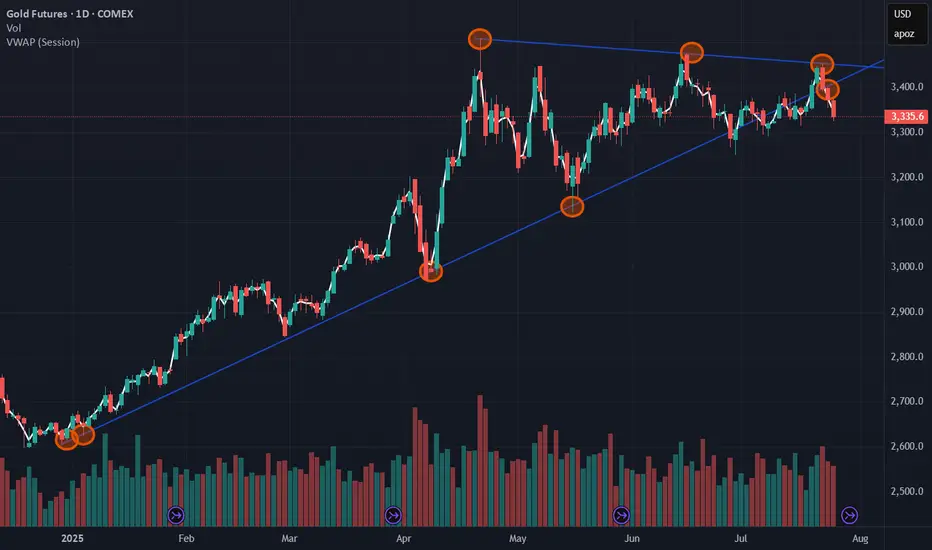
Options Blueprint Series [Intermediate]: Gold Triangle Trap PlayGold’s Volatility Decline Meets a Classic Chart Setup
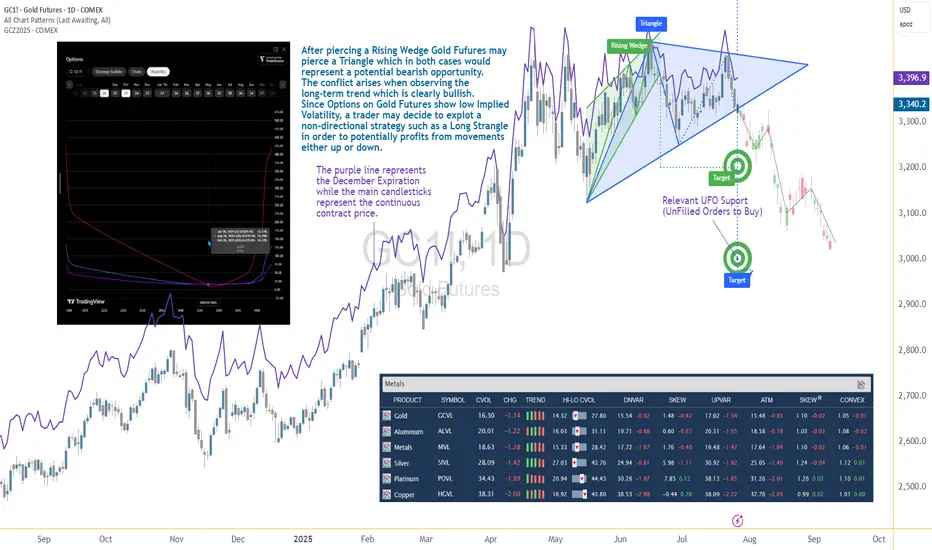
Gold Futures have been steadily declining after piercing a Rising Wedge on June 20. Now, the market structure reveals the formation of a Triangle pattern nearing its apex — a point often associated with imminent breakouts. While this setup typically signals a continuation or reversal, the direction remains uncertain, and the conflict grows when juxtaposed with the longer-term bullish trajectory Gold has displayed since 2022.
The resulting dilemma for traders is clear: follow the short-term bearish patterns, or respect the dominant uptrend? In situations like these, a non-directional approach may help tackle the uncertainty while defining the risk. This is where a Long Strangle options strategy becomes highly relevant.
Low Volatility Sets the Stage for an Options Play
According to the CME Group’s CVOL Index, Gold’s implied volatility currently trades near the bottom of its 1-year range — hovering just above 14.32, with a 12-month high around 27.80. Historically, such low readings in implied volatility are uncommon and often precede sharp price movements. For options traders, this backdrop suggests one thing: options are potentially underpriced.
Additionally, an IV analysis on the December options chain reveals even more favorable pricing conditions for longer-dated expirations. This creates a compelling opportunity to position using a strategy that benefits from volatility expansion and directional movement.
Structuring the Long Strangle on Gold Futures
A Long Strangle involves buying an Out-of-the-Money (OTM) Call and an OTM Put with the same expiration. The trader benefits if the underlying asset makes a sizable move in either direction before expiration — ideal for a breakout scenario from a compressing Triangle pattern.
In this case, the trade setup uses:
Long 3345 Put (Oct 28 expiration)
Long 3440 Call (Oct 28 expiration)
With Gold Futures (Futures December Expiration) currently trading near $3,392.5, this strangle places both legs approximately 45–50 points away from the current price. The total cost of the strangle is 173.73 points, which defines the maximum risk on the trade.
This structure allows participation in a directional move while remaining neutral on which direction that move may be.
Technical Backdrop and Support Zones
The confluence of chart patterns adds weight to this setup. The initial breakdown from the Rising Wedge in June signaled weakness, and now the Triangle’s potential imminent resolution may extend that move. However, technical traders must remain alert to a false breakdown scenario — especially in trending assets like Gold.
Buy Orders below current price levels show significant buying interest near 3,037.9 (UFO Support), suggesting that if price drops, it may find support and rebound sharply. This adds further justification for a Long Strangle — the market may fall quickly toward that zone or fail and reverse just as violently.
Gold Futures and Micro Gold Futures Contract Specs and Margin Details
Understanding the product’s specifications is crucial before engaging in any options strategy:
🔸 Gold Futures (GC)
Contract Size: 100 troy ounces
Tick Size: 0.10 = $10 per tick
Initial Margin: ~$15,000 (varies by broker and volatility)
🔸 Micro Gold Futures (MGC)
Contract Size: 10 troy ounces
Tick Size: 0.10 = $1 per tick
Initial Margin: ~$1,500
The options strategy discussed here is based on the standard Gold Futures (GC), but micro-sized versions could be explored by traders with lower capital exposure preferences.
The Trade Plan: Long Strangle on Gold Futures
Here's how the trade comes together:
Strategy: Long Strangle using Gold Futures options
Direction: Non-directional
Instruments:
Buy 3440 Call (Oct 28)
Buy 3345 Put (Oct 28)
Premium Paid: $173.73 (per full-size GC contract)
Max Risk: Limited to premium paid
Breakeven Points on Expiration:
Upper Breakeven: 3440 + 1.7373 = 3613.73
Lower Breakeven: 3345 – 1.7373 = 3171.27
Reward Potential: Unlimited above breakeven on the upside, substantial below breakeven on the downside
R/R Profile: Defined risk, asymmetric potential reward
This setup thrives on movement. Whether Gold rallies or plunges, the trader benefits if price breaks and sustains beyond breakeven levels by expiration.
Risk Management Matters More Than Ever
The strength of a Long Strangle lies in its predefined risk and unlimited reward potential, but that doesn’t mean the position is immune to pitfalls. Movement is key — and time decay (theta) begins to erode the premium paid with each passing day.
Here are a few key considerations:
Stop-loss is optional, as max loss is predefined.
Precise entry timing increases the likelihood of capturing breakout moves before theta becomes too damaging. Same for exit.
Strike selection should always balance affordability and distance to breakeven.
Avoid overexposure, especially in low volatility environments that can lull traders into overtrading due to the potentially “cheap” options.
Using strategies like this within a broader portfolio should always come with well-structured risk limits and position sizing protocols.
When charting futures, the data provided could be delayed. Traders working with the ticker symbols discussed in this idea may prefer to use CME Group real-time data plan on TradingView: www.tradingview.com - This consideration is particularly important for shorter-term traders, whereas it may be less critical for those focused on longer-term trading strategies.
General Disclaimer:
The trade ideas presented herein are solely for illustrative purposes forming a part of a case study intended to demonstrate key principles in risk management within the context of the specific market scenarios discussed. These ideas are not to be interpreted as investment recommendations or financial advice. They do not endorse or promote any specific trading strategies, financial products, or services. The information provided is based on data believed to be reliable; however, its accuracy or completeness cannot be guaranteed. Trading in financial markets involves risks, including the potential loss of principal. Each individual should conduct their own research and consult with professional financial advisors before making any investment decisions. The author or publisher of this content bears no responsibility for any actions taken based on the information provided or for any resultant financial or other losses.
New Week...New Bullishness on Gold???Sorry my post have not been showing up. I have mistakenly been posting them as private! lol. But new week on gold looking to see some good bullish action this week but it also is the end of the month and price could stall till we get some news to move it. I need more confirmation before taking any moves so we are watching for now.

GOLD - GC Weekly Recap & Outlook | 27.07.2025🧾 Weekly Recap:
• Price tapped into the 1H Demand Zone (red box) and ran the 4H swing liquidity before bouncing to clear internal range liquidity.
• This move was followed by a retracement which led to a break of the bullish trendline.
This may signal the beginning of a broader accumulation phase. Expect choppy price action targeting internal liquidity both above and below, before a clear trend resumes.
📌 Technical Analysis:
Price has closed below the bullish trendline, leading to two possible scenarios:
1. Bullish scenario (black path):
– Price runs the W C DOL (3313$) →
– Finds rejection →
– Retests broken trendline →
– Breaks above the trendline →
– Continues toward 3444$ and potentially 3474$
2. Bearish scenario (orange path):
– Price runs W C DOL (3313$) →
– Rejects from the broken trendline →
– Fails to reclaim it →
– Continues downward to target M C DOL (3256$)
📈 Setup Trigger:
Wait for clear 1H–4H supply/demand zone creation and structure shift before initiating a trade.
🎯 Trade Management:
• Stoploss: Above/below relevant supply-demand zone
• Targets:
– Bullish: 3444$, 3474$
– Bearish: 3256$
🟡 If you liked the idea, feel free to drop a like & comment — and don’t forget to follow for more weekly updates.

Gold. GC1! Weekly Outlook. 27.07.2025, SundayCOMEX:GC1!
Outlining gold on HTF. Waiting for FOMC and NFP

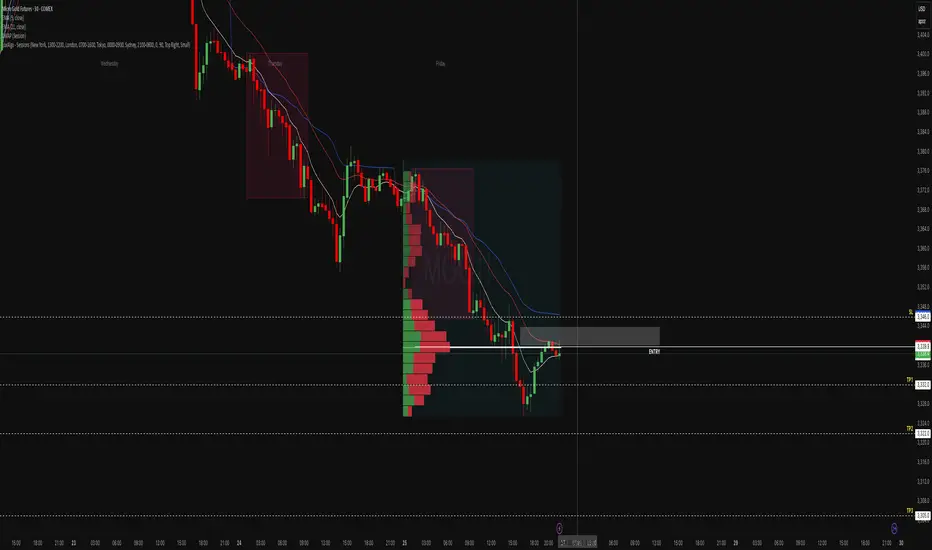
MGC Tokyo Fade: If It Rejects, It DiesThis one was a request from someone asking for a breakdown of MGC heading into the Tokyo session so here’s the full quant review.
After Friday’s clean liquidation, gold found temporary footing around 3330. But the bounce is stalling under VWAP (3344) and Friday’s POC both stacking resistance like a ceiling of bricks. EMAs are fanned and directional, suggesting sellers still control the structure.
VWAP + POC = kill zone for a potential Tokyo fade.
Quant Review:
- Friday Session POC: 3341.9 — currently acting as resistance
- VWAP (Session): 3344.6 — unclaimed on the bounce
- 9 & 21 EMAs: Bearishly stacked, aligned with VWAP
- Volume Profile: Value area is lower; price is rejecting acceptance higher
- Microstructure: Weak bounce into resistance without reclaim of structure
Trade Plan (Short Bias):
- Entry Zone: 3340–3344 (VWAP/POC cluster)
- Trigger: Bearish engulfing or LTF rejection off VWAP shelf
- TP1: 3332 (prior low)
- TP2: 3322 (thin node sweep)
- TP3: 3305 (session low extension)
- Stop Loss: Above 3346 (structure + shelf break)
- R:R: 1.5–5 depending on scaling
- Probability of rejection and drop to 3332: 65%
- Probability of full leg to 3322–3305: 30%
- Risk of breakout above VWAP: 5%
If I’m Wrong
The Sunday open is always a wildcard sometimes you get pure trend continuation, other times it’s total chop or liquidity grabs before the real move unfolds in London.
If price cleanly reclaims 3346, closes above with strength, and holds the short idea is off. At that point, I’d expect a sweep toward 3355–3360, potentially tagging the high-volume node from mid-Friday.
In that case: Flip bias to bullish retrace into early London.
Bonus:
If you ever want a quant-style breakdown or session analysis like this just reach out. We break it down with structure, stats, and setups.
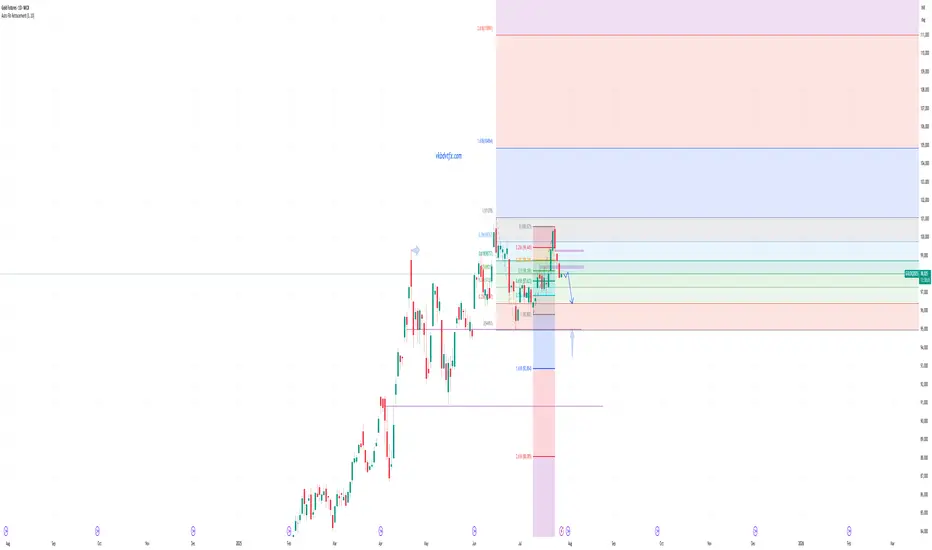
Near Term Bearish Development on Gold?The three bearish days in a row could be a potential near term bearish development on Gold. If a retest somewhere between 3370 and 3400 happens relatively soon and rejects it could potentially be in for a bearish extension. 3373 would be the 0.618 and 3388 would be the 0.5 retracement area. With a potential target down toward 3248 area
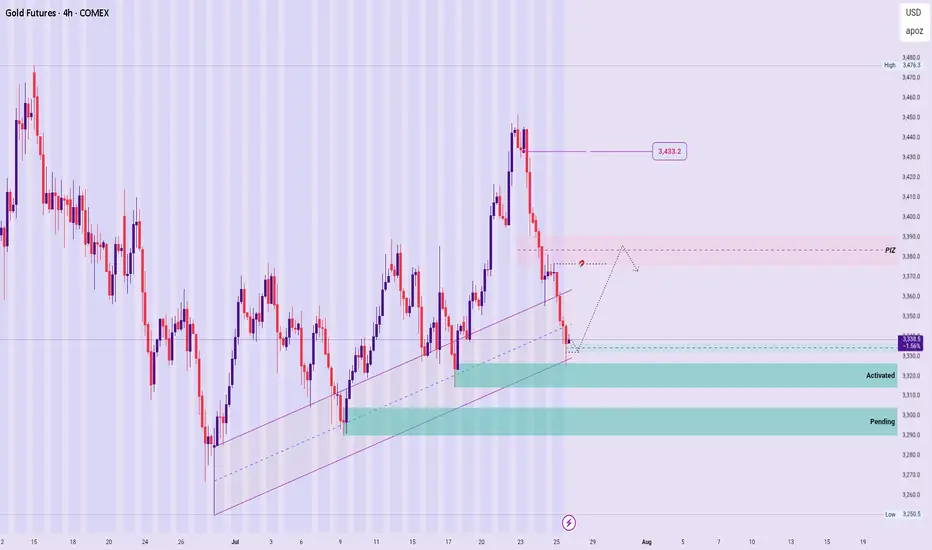
GOLD – New Week Technical Bias (Market Open)
Structural Outlook:
The broader bullish sequence remains valid, with no structural breach confirmed yet.
However, price is currently reacting at a sensitive level, warranting measured caution.
Zone Dynamics :
▪︎ A recently activated Rejection Zone is expected to support a gradual impulse toward the PIZ.
▪︎ From the PIZ, two scenarios unfold:
a. If it becomes a Price Base, we may see a continuation rally toward the 3433.2 region.
b. If the PIZ acts instead as a Price Cap, price may reject lower, targeting the pending Rejection Zone beneath or deeper, should the current zone fail to hold. Thereby presenting a Bearish structural formation.
Summary:
The directional bias remains bullish unless a clear Structure Breach (SB) occurs below key support levels.
Stay adaptive, and observe the PIZ reaction closely for directional confirmation.
🛑 Disclaimer:
This is not a trade signal. These are high-level technical insights meant for educational and analytical purposes. Always validate with your system and trade with discipline and risk awareness.
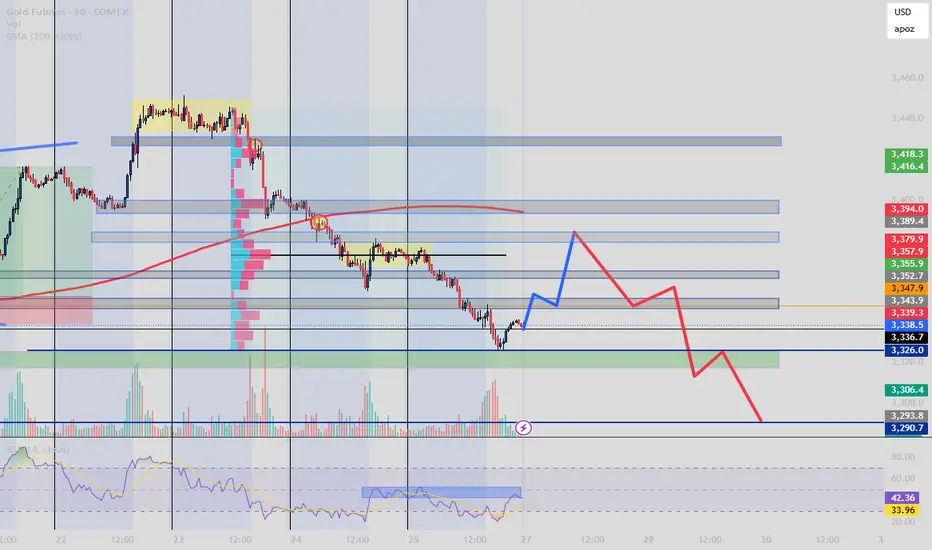
Gold Futures and the BOS Brearish Movement Steps In?After a clear break of structure and consistent rejection below the 209 EMA, price is retracing toward a key zone of confluence between 3347–3379.
This area aligns with:
Former demand turned supply (OB)
Volume cluster (high activity zone)
RSI hidden bearish divergence
Fair Value Gap (inefficiency fill target)
My expectation: a short-term bullish correction (blue) into that zone, followed by a high-probability sell-off (red) toward 3306–3290.
Bias : Bearish unless price reclaims 3394+
Strategy: Smart Money + Volume Profile + RSI Confirmation
Follow @GoldenZoneFX For more content and valuable insights.
Is GC1! GOLD At A Turning Point - Idea On Short DirectionProbably Gold is not going to be cheaper in the near future but we have seen some points that hold in the past break recently...
This is a view on the Gold chart that is explanatory by itself.
Probably tracing some support horizontally under the price at key level with the idea of, if it break follow the trend in short direction side...
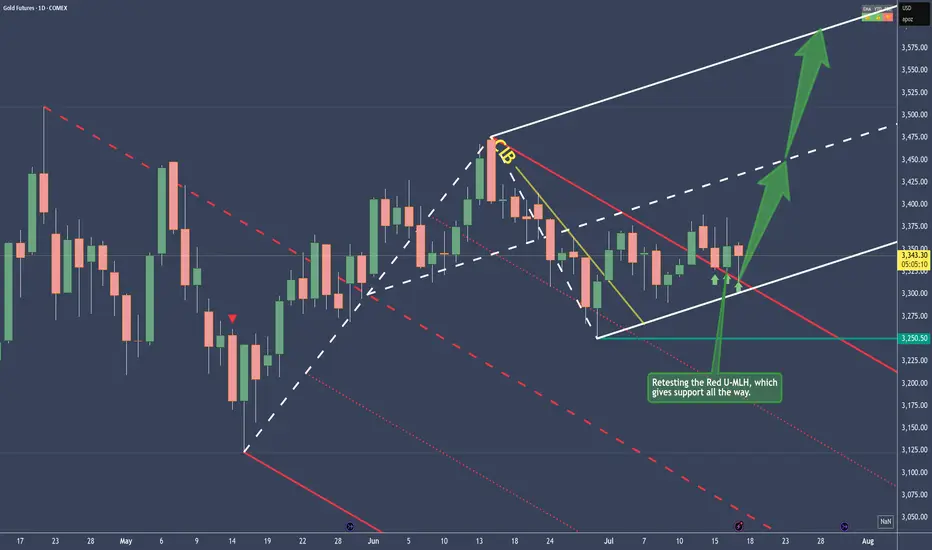
Gold - Bullish and here's whyPrice traveled within the Red Fork, until it broke the CIB Line, which is indicating a Change In Behavior.
From there on, sideways action, until the break of the Red U-MLH happened.
After the close above the Red U-MLH, price has tested it the 3rd time now. At the time of writing, the Bar looks like a PinBar. So it has good sepparation from the bottom, or a long Down-Wick. That's indicates good strenght.
To me this looks like a good long trade, but as everytime, play it save and don't let greed eat your brain ;-)
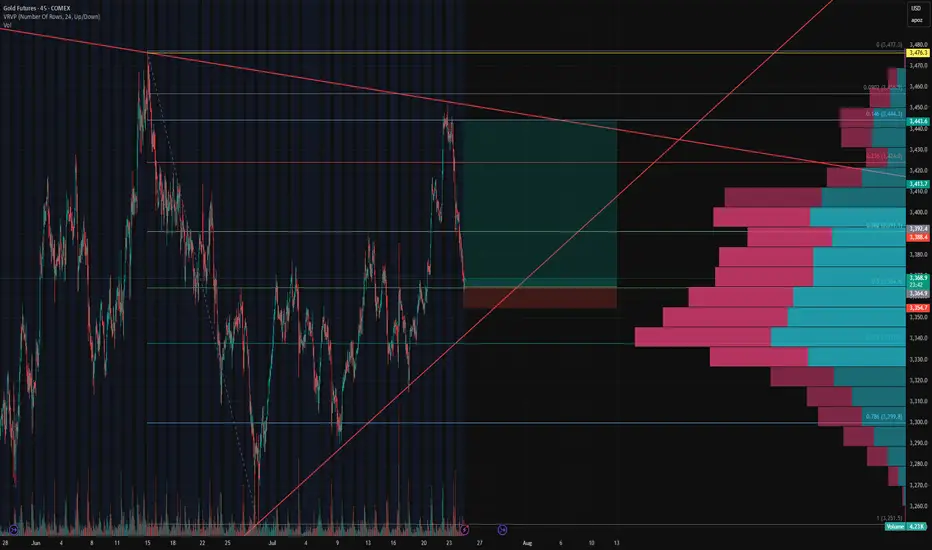
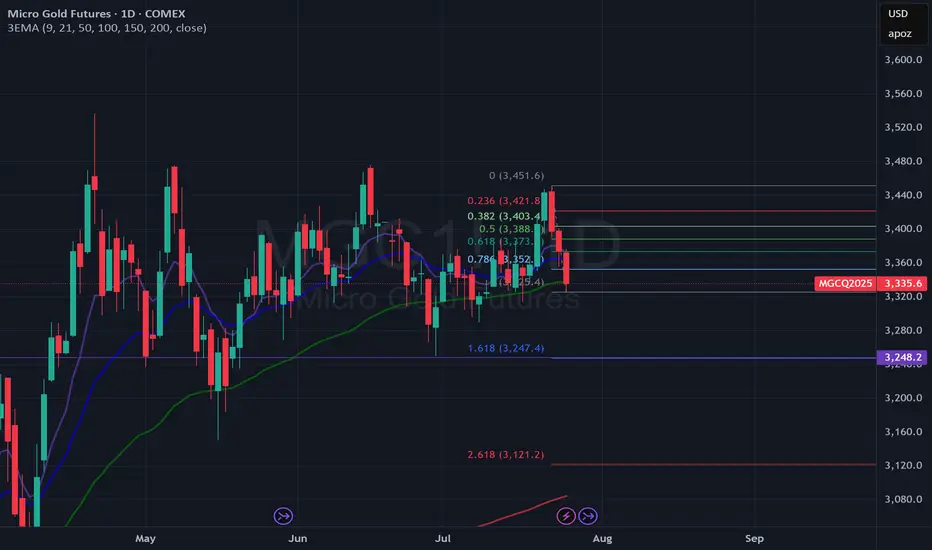
Gold Futures Update – 0.5 Fib Stop Hit, Eyes on 0.618 ConfluenceGold Futures Update – 0.5 Fib Stop Hit, Eyes on 0.618 Confluence
Our initial long setup at the 0.5 Fibonacci retracement level has been stopped out, but the structure remains constructive.
Price is now approaching a key confluence zone at $3,336 , where:
The 0.618 fib retracement from the recent swing low to high aligns perfectly,
The ascending trendline support (respected multiple times since May) intersects, and
The oint of Control (POC) from the visible volume profile shows dominant volume transacted.
This area represents a high-probability support level where bulls may attempt to defend again. We’re monitoring for reaction and potential entry signals around this level. A break below would invalidate the rising wedge structure and shift bias toward lower fib extensions.
GOLD BULLISHHello,
Here's the gold analysis:
Gold will have started an upward trend with a good probability of 80%.

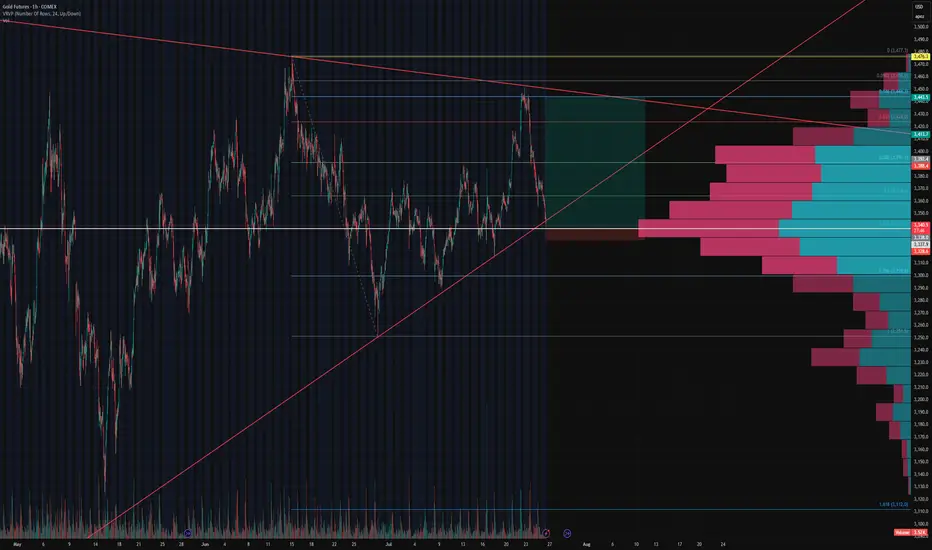
Gold Futures (GC1!) Long Setup – 0.5 Fib Bounce🟡 Gold Futures (GC1!) Long Setup – 0.5 Fib Bounce
After nailing the long from the bottom and perfectly shorting the top, we’re stepping back in for another calculated move.
📉 Price pulled back to the 0.5 Fibonacci retracement, aligning perfectly with the upward trendline support and a key HVN on the Volume Profile.
📈 Entered long at 3,365 with a tight stop below 3,354 (0.3% risk), targeting the descending trendline near 3,444 for a clean 7.7R setup.
🧠 Context:
Price reacted hard at resistance, but volume support and structure still lean bullish.
Clear invalidation if we break trend and lose 3,350 support cluster.
Let’s see if this bounce gets legs. 🚀