GC1: Buy ideaHello traders.!!! On GC1! as you can see on the graph, we would have a high probability of having an increase if all the analysis conditions are met...!!!
GF101! trade ideas

GC1! Top of the Market?!? One more try on the gold short for this week and if it doesnt work I am never shorting gold again lol

GOLD in daily chartfollowing my last published idea for gold I want to share this update with you. There are many alternatives for GOLD counting but the main point is not to trade before it decides about blue channel. If it passes the blue channel then I long it but I do not want to get in the uncertain trend. Bearish signals are also considerable.
Thanks

Gold Options Activity Point to Continuing RallyNot a single macro portfolio manager was fired for adding gold to their portfolio over the last two years. Such has been gold’s stunning performance. Will Gold’s ascent continue?
Narratives and numbers signal unstoppable and solid bull run in gold for now.
BULL CASE REMAINS INTACT AND IS INTENFISYING
This paper will not delve much into fundamentals. We have covered it previously in Gold to Shine Bright on Fundamentals, Seasonality & Sentiments . In that we highlighted the three main forces at play: (a) Continued central bank purchases, (b) Rising consumer demand in China & India, and (c) Trump administration’s fiscal policies favouring gold.
In addition to the above, US Dollar weaponization, De-dollarisation fears, and Tariff tensions, serve as additional tailwinds. TradingView Wizard, Konhow , has comprehensively covered the historical impact of tariffs on Gold in his recent paper and video .
SENTIMENTS HAVE SURRENDERED IN FAVOR OF RISING GOLD
This research note will not dive into the weeds of technical analysis either. TradingView’s Technical Analysis dashboard summarises it all elegantly.
TradingView
Momentum is in favour. Oscillators are neutral indicating little risk of price reversal. Overall, sentiment remains bullish gold.
Gold prices as represented by CME Micro Gold Futures front month contract formed a golden cross on 10th January 2025. Since then, prices are up 8.5% as of 13th February 2025. Current prices are well above its 50-day, 100-day, and 200-day DMAs.
RSI is in overbought zone. Expect some pull back in gold prices from time to time on profit taking. But the upward trend is undeniable. The MACD shows that Gold momentum continues to be on the rise but with waning bullishness.
Readers can access the entire library of technical ideas focussing on Gold on TradingView’s Gold Ideas Page ideas page .
OPTIONS MARKETS ARE SIGNALLING A SOLID BULL RUN AHEAD
This paper aims to unpack recent activity in CME gold options market and its impact on prices. No contrary signals there either. Options market also signal bullish gold.
QuikStrike is a free-to-use tool for registered participants on the CME Group website. The tool provides a vast range of analytics to guide portfolio managers & traders to better comprehend the underlying market. Each report comes with a helpful user-guide to describe the data covered within the report.
Some key takeaways below:
Open Interest Profile page shows that as of close of markets on 11th February 2025, total call open interest (“OI” for short) stood at 634,815 lots across all expiries and strikes. Aggregate put IO totalled up to 357,305 lots resulting in a put-call ratio (p/c ratio) of 0.56.
Calls are options contract that represent a bullish view. While puts are contracts representing bearish outlook. At 0.56 p/c ratio, there are twice as many bullish positions for each bearish one.
Source: CME QuikStrike
Most Active Strikes allow portfolio managers and traders to analyse top strikes with shifts in open interest. Table below shows top 10 strikes registering the largest change in open interest between 4th February and 11th February.
Starting first with the Calls (left section of the table below), participants have been building up open interest in strikes 4000, 3200, 3250, 4500, 4032, and 3,975.
Call options have also booked reduction in open interest at strikes 3000, 3075, 3100 and 3025. On a net-basis, open interest is up 10,312 lots across these top ten strikes over various expiries this year.
Source: CME QuikStrike
Puts (right section of the table above) shows rising build up in open interest for strikes ranging from 2740 to 2880.
Collectively, this indicates that market participants are rooting for gold prices to rise through USD 3,000/oz and to even rally past USD 4,500/oz. Will that happen? Only time will tell.
Given that risk managers are establishing puts at such high levels point to strong support for gold prices at current levels.
In a nutshell, current prices are not only formidably comfortable but the potential to rise is also highly probable.
Shifting the attention to volatility, the CME Group also offers CVol which is another free-to-use tool. Portfolio managers and traders can visualise implied volatility behaviour on this tool.
Source: CME CVol
The GCVL which is the Gold CVol index shows implied volatility at 17.65 and with a positive skew of 1.08. Implied volatility easing even at an elevated prices indicates that market participants are comfortable at current price levels and do not foresee immediate large price moves.
Skew on the CVol tool is defined as Up Var minus Down Var. Up Var is the likelihood of the price rising while Down Var measures the likelihood of prices falling. A positive skew shows that the market is pricing a higher likelihood of rising prices relative to a down move.
FUND FLOWS INTO GOLD ETF IS UP 47% YOY
Among its rich set of features, TradingView also shows daily ETF fund flows . GLD is the prominent ETF commanding assets under management (AUM) of USD 80.65 billion.
This time last year, GLD ETF showed AUM of USD 54.77 billion. Fund inflows have spiked 47.25% over the past 12 months.
HYPOTHETICAL TRADE SETUP
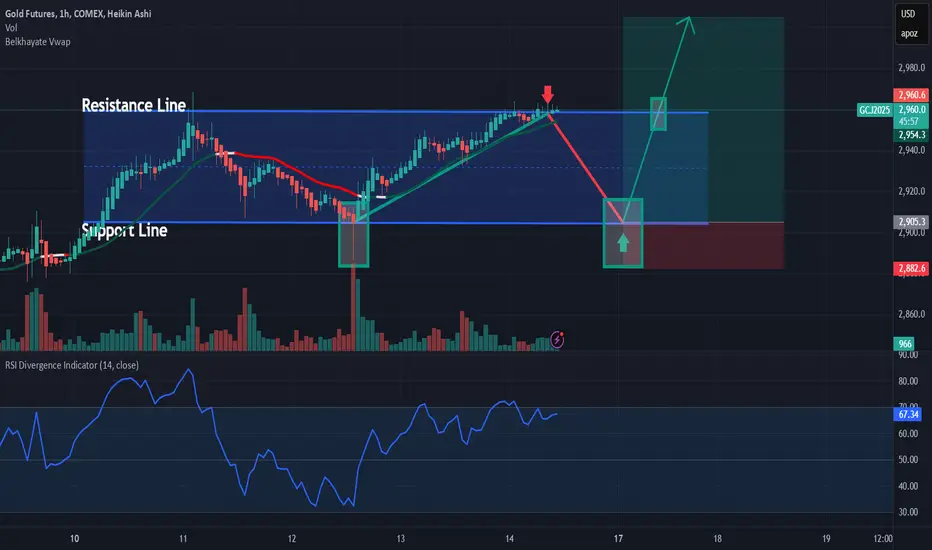
With fundamentals, sentiment, options market, and fund flows all pointing to a price that is set to rise, this paper posits a long position using CME Micro Gold Futures expiring on 28th April 2025 (MGCJ2025) based on the following entry, exit levels and the reward-to-risk ratio:
• Entry: USD 2,900/oz
• Target: USD 3,100/oz
• Stop: USD 2,800/oz
• P&L at Target (USD per lot): +2,000 ((3,100 – 2,900) x 10)
• P&L at Stop (USD per lot): -1,000 ((2,800 – 2,900) x 10)
• Reward-to-Risk Ratio: 2x
Please note that Each Micro Gold Futures contract provides an exposure to 10 troy ounces.
Both standard-sized gold futures (GC) and the newly launched 1-ounce gold futures offer avenues to express bullish sentiment on the yellow metal. This comprehensive suite of gold futures is tailored to enhance flexibility and precision, empowering investors to capitalize on market opportunities effectively.
CME Group lists a raft of products covering a range of asset classes more accessible while also enabling granular hedging for portfolio managers.
Portfolio managers can learn more on how to access these micro products by visiting CME Micro Products page on CME portal to discover micro-sized contracts to gain macro exposures.
In collaboration with the CME Group, TradingView has launched The Leap trading competition. New and upcoming traders can hone and refine their trading skills, test their trading strategies, and feel the thrill of futures trading with a vibrant global community through this paper trading competition sponsored by CME Group using virtual money and real time prices.
The competition lasts another 15-days. Please join the 48,000+ others who are actively honing their trading skills using virtual money. Click here to learn more.
MARKET DATA
CME Real-time Market Data helps identify trading set-ups and express market views better. If you have futures in your trading portfolio, you can check out on CME Group data plans available that suit your trading needs tradingview.com/cme .
DISCLAIMER
This case study is for educational purposes only and does not constitute investment recommendations or advice. Nor are they used to promote any specific products, or services.
Trading or investment ideas cited here are for illustration only, as an integral part of a case study to demonstrate the fundamental concepts in risk management or trading under the market scenarios being discussed. Please read the FULL DISCLAIMER the link to which is provided in our profile description.

BEARISH GC1! Position StartedWith gold struggling near intraday resistance, it might be time to start looking the other way as this bullish run may start to correct.

GOLD set to Make New Highs!Now that we have gotten past the fed news Im looking for a entry to continue bullish action. but we must wait for killzones.

Gold and Silver Out of Sync-Extreme Sentiment and Runaway Movesgold and silver futures chart analysis and why gold may no longer predictably be used to time the silver moves at this period in time; though there are several ways for silver to reach 37-43 and ultimately 50, as gold is likely set to overshoot 3000.

GOLD [4H] - 12.2.2025After reaching 1.61 Fibbo., I do expect a correction towards 2,800 AUX/USD, and in March upward trend over 3,000 AUX/USD.


Can Rainbow MG3 Secure in the CME Trading Competition's Top 10?
Can Rainbow MG3 Secure a Spot in the CME Trading Competition's Top 10?
I've joined the CME trading competition 13 days late, but that hasn't stopped me from making an impact. After just two days of trading Bitcoin and Gold, my account is already up 6%, placing me in the top 14% out of nearly 50,000 traders.
The top 10 traders in the competition—many of whom are pro traders—have already racked up over $1 million in profits, making them part of the elite top 5%. The gap between them and the rest of the field is significant.
With 16 days left, my goal is to break into the top 10. I'm relying on the Rainbow MG3 indicator as my primary tool. The question is: Can Rainbow MG3 help me achieve this?
🚀 Follow my journey as I put this strategy to the test!

Is Gold Overdone?
After an impressive rally which saw gold break through the $2,900/oz level for the first time, the market appears poised to blow off some steam.
Key Points:
- High on the daily RSI was set at the end of January and has been flashing divergence since then.
- The RSI has been in a consolidation channel for the last few weeks but broke through to move lower this morning. The current RSI is sitting just below 50.
- This morning, gold broke through the BB midpoint AND the lower trend channel.
- Really bearish closing candle on the daily yesterday.


Gold's Final Push: $3,000 Target in SightGold (XAUUSD) remains in strong demand, revising the prior bearish outlook. Price action now targets $3,000, completing a possible final wave as part of the bullish structure. This move likely marks the last ride before a potential correction. Watch for key resistance near $3,000.

Gold Sweeps before Major PlaysWait if you looking for the move! Cause price will give us some type of validation of what it wants to do. It can remain bullish and break through this area or it can pull back and grab some liquidity before continuing. We just have to wait for the killzones to show up a clearer read.

Gold On Thin Ice!**Current Trends and Future Prospects in the Gold Market: An In-Depth Analysis**
In the past two years, gold has seen an impressive surge, almost doubling in value. This rally has captured the attention of investors worldwide, driving them to seek refuge in this precious metal amid uncertain economic landscapes. However, with this meteoric rise comes a growing concern: is gold still a safe haven, or is it teetering on the edge of a significant correction?
**Gold's Meteoric Rise: A Double-Edged Sword?**
The comparison to the U.S. dollar's performance in 2022 is noteworthy. The dollar, which enjoys a higher liquidity status compared to gold, experienced a dramatic 12% drop in value within a span of just three months. This sharp decline highlights a critical vulnerability in what was previously considered a safe and stable investment.
**Potential Risks and Market Overcrowding**
Given the parallels, there is an increasing risk that gold might face a similar fate. The gold market, currently saturated with bullish investors, hints at an impending correction. Analysts suggest that a potential value correction could see gold prices plummet by $500 to $1,000 per ounce. Such a correction would have profound implications, shaking investor confidence and market stability.
**The Crowded Market and Limited Gains**
The current influx of cash into gold also contributes to this precarious situation. As more investors flock to gold, the chances of a significant correction heighten. Moreover, with such a crowded market, the potential for substantial gains narrows. Bullish positions might push gold to a ceiling of around $3,000 to $3,200 per ounce, but beyond this range, the market may struggle to sustain further growth.
**Shift in Cash Flow: From Gold to the Dollar**
In the event of a correction, it is likely that we will witness a shift in cash flow from gold to the more liquid U.S. dollar. This shift would not only underscore the dynamic and often volatile nature of global investments but also demonstrate how investor sentiment can pivot quickly in response to market changes.
**Long-Term Outlook: Geopolitical Influences on Gold's Value**
Looking ahead, geopolitical tensions and shifts in global reserves could significantly impact gold's value. Nations opposed to the United States may continue to increase their gold reserves as a strategic counterbalance, potentially driving gold prices up to $3,700 per ounce in the long term. This geopolitical factor introduces an additional layer of complexity to the already intricate gold market landscape.

GOLD - WEEKLY SUMMARY 3.2-7.2 / FORECAST🏆 GOLD – 13th week of the base cycle (15-20+ weeks), 3rd phase of the cycle. The pivot forecast on February 3 worked as a reversal of Monday’s overnight tariff hysteria. The major trend from the December 18 extreme forecast continues.
⚠️ By Friday’s close, we saw a breakout of the previous top at the October 28 extreme forecast level (2800 on the current futures contract). This level may now become strong support. I believe strong hands didn’t fall for the tariff hysteria and held their long positions from the January 29 extreme forecast. Next extreme forecast: March 3. Next pivot forecast: February 11.

GC! Double Top at ATHThis could be a strong opportunity to take a short position. If the price continues to test this resistance and fails, we anticipate a move lower towards the next support zone with a possible gap close on this 4H chart in the coming weeks.

New Week New GOLD Opportunities! Price is extremely bullish but we must wait for price to establish a Low for the week first before getting in for the bullish move. Since we are just in Tues this week we still have plenty of time for a set up to form. just have to be patient.

Renewing daily new highs (ATH)...
Hello, traders.
If you "Follow", you can always get new information quickly.
Please click "Boost" as well.
Have a nice day today.
-------------------------------------
(GCL1! 1M chart)
GCL1! is renewing daily new highs (ATH).
It is not easy to analyze or trade these stocks.
Since it is supported and rising near the right Fibonacci ratio point of 1 (2828.6), there is a possibility that it will rise to the Fibonacci ratio range of 1.618 (3395.3) ~ 1.618 (3457.6).
However, since it is a state where it is not strange to fall at any time, you should think about a countermeasure for the fall when starting a transaction.
-
(1D chart)
Most chart analysts explain the current chart analysis by substituting issues other than the chart.
If you get used to this method, you may find issues other than the chart first without looking at the chart and analyze the chart while being obsessed with your subjective thoughts.
If you do that, you may analyze the chart in the wrong direction because you will interpret the chart with your subjective thoughts instead of looking at the chart as it is, so you need to be careful.
When analyzing charts, you must first look at the chart and analyze it, and then look for issues other than the chart when you have time.
-
In order to trade a stock that is renewing its ATH, you should check for support when it shows a downward trend and start.
However, since it is renewing its ATH, there is no support or resistance point to check for support.
To compensate for this, we use the 5EMA+StErr indicator and the Price Channel indicator.
Therefore, when the price falls and touches the 5EMA+StErr indicator or the Price Channel indicator, you can find the trading point depending on whether there is support.
-
(30m chart)
You can trade when it breaks out of the section made up of the Price Channel indicator or the box section made up of the HA-High and HA-Low indicators.
Of course, trading is also possible within the box section.
At this time, you should be careful that the trend can change when it passes the MS-Signal indicator.
When you touch the 5EMA+StErr indicator on the 1D chart, you can check whether there is support and trade.
-
Thank you for reading to the end.
I hope you have a successful trade.
--------------------------------------------------

GOLD, Short, 1h✅ GOLD is pulling back to the 0.236 Fibonacci level, where a temporary decline is expected before continuing its movement. The price is also likely to reach the 21 EMA as part of this retracement.
SHORT 🔥
✅ Like and subscribe to never miss a new analysis! ✅

Is this the Pull Back Zone On Gold XAU GC1! In this video I highlight the potential area for a pull back on Gold Using the TR Pocket and Trend based Extension tool . Using these tools combined we were able to establish a zone of perfect confluence for a downside reaction on Gold. Also I use the new Demonstration Cursor released by Tradingview to highlight the levels on the chart of where my fib pulls were made.
In addition to the above I noticed after completing the video that we have yearly pivots that are untapped around $2580.
CPI on Wednesday may give us the narrative for the reaction up at those highlighted highs and to begin cooling off . I welcome your engagement Boosts comments + follows . Enjoy Ty

Gold’s Correction Ahead? Technical Signals Point to Bearish MoveGold (XAUUSD) on the 4H timeframe signals a potential bearish move. Wave (X) appears complete, with an ABC correction likely targeting $2,645.90 (1:1 W=Y). Bearish RSI & Stochastic divergence suggest weakening momentum, supporting downside bias. Wave 4 may complete before a bullish continuation.
