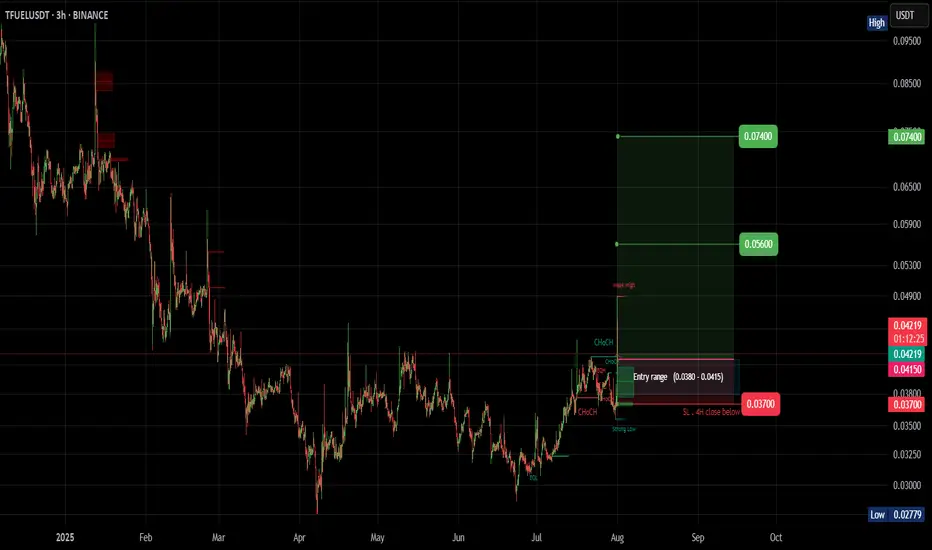
#TFUEL (SPOT)BINANCE:TFUELUSDT
#TFUEL/ USDT
Entry (0.0380 - 0.0415)
SL 4H close below 0.037
T1 0.056
T2 0.075
_______________________________________________________
Golden Advices.
********************
* collect the coin slowly in the entry range.
* Please calculate your losses before the entry.
* Do not enter any trade you find it not suitable for you.
* No FOMO - No Rush , it is a long journey.
TFUELUSDT trade ideas
Theta Fuel Whale Mistake Bullish Signal RevealedLook at this... The charts reveal everything always before the event takes place.
This happened yesterday on KuCoin, TFUELUSDT grew 185% but all the gains were removed.
The peak happened at 0.09500. This means one thing and one thing only, there is no longer any resistance all the way up to that price. All the sell orders that were placed have been filled. This means that once the market turns bullish, this pair will move straight up. That's the proof, right there, yesterday's candle.
This signal can be read in many different ways but they are all bullish, so, what will you do?
Theta Fuel is going up. You read about it here first.
Thanks a lot for your continued support.
I am keeping it simple; simple is best.
Namaste.

TFUELUSDT 1W AnalysisTFUEL ~ 1W Analysis
#TFUEL Buy back gradually from here if you still have confidence in this coin with a short term target of at least 20%+ from here.

TFUELUSDT UPDATETFUEL/USDT Technical Setup
Pattern: Falling Wedge Breakout
Current Price: $0.03465
Target Price: $0.045, $0.065
Target % Gain: ~30% to ~87%
Technical Analysis: TFUEL has broken out of a long-term falling wedge on the daily chart. The breakout is supported by a strong bullish candle and increasing momentum, indicating a potential upside move.
Time Frame: 1D
Risk Management Tip: Always use proper risk management.

TFUELUSDT 1WTFUEL ~ 1W Analysis
#TFUEL Buy from here if you still have a Conviction on this coin.
Reason, This is a block of support that has been maintained so far.

TFUELUSDT UPDATETFUELUSDT is a cryptocurrency trading at $0.05370. Its target price is $0.09000, indicating a potential 50%+ gain. The pattern is a Bullish Falling Wedge, a reversal pattern signaling a trend change. This pattern suggests the downward trend may be ending. A breakout from the wedge could lead to a strong upward move. The Bullish Falling Wedge is a positive signal, indicating a potential price surge. Investors are optimistic about TFUELUSDT's future performance. The current price may be a buying opportunity. Reaching the target price would result in significant returns. TFUELUSDT is poised for a potential breakout and substantial gains.

Trading opportunity for TFUELUSDTBased on technical factors there is a Buy position in :
📊 TFUELUSDT
🔵 Buy Now
🪫Stop loss 0.04300
🔋Target 0.06300
📏 R/R 2
💸RISK : 1%
We hope it is profitable for you ❤️
Please support our activity with your likes👍 and comments📝

Trading opportunity for TFUELUSDTBased on technical factors there is a Sell position in :
📊 TFUELUSDT
🔴 Sell Now
🪫Stop loss 0.07320
🔋Target 0.05150
📏 R/R 2
💸RISK : 1%
We hope it is profitable for you ❤️
Please support our activity with your likes👍 and comments📝

TFUELUSDT (ThetaFuel) Updated till 12-01-25TFUELUSDT (ThetaFuel) Daily timeframe range. we can see a move on slow day in the market. which is a good thing. 0.09332 is a old resistance a little bit push can give it a valid close. a valid close can open its mid level till 0.12094. local support at 0.06342.

#TFUEL (SPOT) IN ( 0.04900- 0.06800) T. (0.16600) SL(0.04771)BINANCE:TFUELUSDT
#TFUEL / USDT
Entry ( 0.04900- 0.06800)
SL 1D close below 0.04771
T1 0.08900
T2 0.11000
T3 0.20000
T4 0.28600
2 Extra Targets(optional) in chart, if you like to continue in the trade with making stoploss very high.
______________________________________________________________
Golden Advices.
********************
* collect the coin slowly in the entry range.
* Please calculate your losses before the entry.
* Do not enter any trade you find it not suitable for you.
* No FOMO - No Rush , it is a long journey.
Useful Tags.
****************
My total posts
www.tradingview.com
1Million Journey
www.tradingview.com
www.tradingview.com
**********************************************************************************************
#Manta #OMNI #DYM #AI #IO #XAI #ACE #NFP #RAD #WLD #ORDI #BLUR #SUI #VOXEL #AEVO #VITE #APE #RDNT #FLUX #NMR #VANRY #TRB #HBAR #DGB #XEC #ERN #ALT #IO #ACA #HIVE #ASTR #ARDR #PIXEL #LTO #AERGO #SCRT #ATA #HOOK #FLOW #KSM #HFT #MINA #DATA #SC #JOE #RDNT #IQ #CFX #BICO #CTSI #KMD #FXS #DEGO #FORTH #AST #PORTAL #CYBER #RIF #ENJ #ZIL #APT #GALA #STEEM #ONE #LINK #NTRN #COTI #RENDER #ICX #IMX #ALICE #PYR #PORTAL #GRT #GMT #IDEX #NEAR #ICP #ETH #QTUM #VET #QNT #API3 #BURGER #MOVR #SKL #BAND #ETHFI #SAND #IOTX #T #GTC #PDA #GMX #REZ #DUSK #BNX #SPELL #POWR #JOE #TIA #TFUEL

#TFUEL/USDT Ready to go up#TFUEL
The price is moving in a descending channel on the 1-hour frame and sticking to it well
We have a bounce from the lower limit of the descending channel, this support is at 0.06320
We have a downtrend, the RSI indicator is about to break, which supports the rise
We have a trend to stabilize above the moving average 100
Entry price 0.06900
First target 0.07350
Second target 0.07794
Third target 0.08200

TFUELUSDTTFUEL ~ 1W
#TFUEL So far it continues to maintain this support block,. If you still have Conviction on this coin,. You can buy after breaking through this resistance line or buy gradually from here. Minimum target 20%+++

Can #TFUEL Bulls Really Keep Up With Current Bullish Momentum? Yello, Paradisers! Can #TFUEL bulls really keep up with the current bullish momentum or not? Let's discuss the latest analysis of #ThetaFuel:
💎After breaking through its descending channel resistance, #TFUELUSDT is showing promising signs of bullish momentum. However, its rally has been stalled at a crucial resistance level of $0.0794. This minor resistance is a key hurdle; if breached, it could mark a significant shift in market structure and open the door for #ThetaFuel to target higher price levels. A clean break above this zone would likely validate the bullish outlook, signaling market confidence and a potential trend reversal.
💎On the flip side, the downside risks cannot be ignored. If #TFUEL fails to push above $0.0794, the price may slip further to test the major support range between $0.0478 and $0.0518. This zone, aligned with a previous significant low, serves as a critical safety net for buyers. A failure to hold this level would likely lead to a retest of the $0.0413 demand area, a last line of defense for the bulls.
💎Should #TFUEL close below $0.0413 on the daily chart, the bullish case would be invalidated entirely. Such a move would shift the narrative to a bearish outlook, increasing the likelihood of forming a new lower low and potentially triggering deeper declines as market sentiment deteriorates further.
Stay focused, patient, and disciplined, Paradisers🥂
MyCryptoParadise
iFeel the success🌴

TFUEL breaking upFollowing the BINANCE:THETAUSDT trade setup the second token of this project is breaking up
More info to come

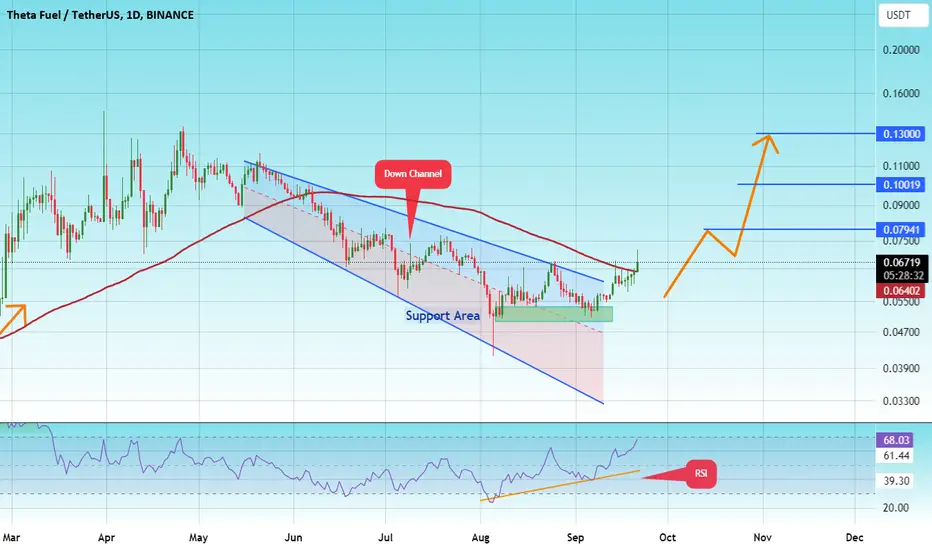
#TFUEL/USDT#TFUEL
The price has broken the descending channel on the 1-day frame upwards and is expected to continue
We have a trend to stabilize above the moving average 100 again
We have an upward trend on the RSI indicator that supports the rise by breaking it upwards
We have a support area at the lower limit of the channel at a price of 0 0.05200
Entry price 0.6000
First target 0.07940
Second target 0.1000
Third target 0.1300
TFUELUSDT 1D#TFUEL has broken out of the falling wedge pattern to the upside. More upward movement is expected if it flips above the daily MA100. The following targets are in focus:
🎯$0.08019
🎯$0.09276
🎯$0.10532
🎯$0.12087

TFUELUSDT 1WTFUEL ~ 1W
#TFUEL If you have Conviction on this token, We tell you a good support block to start buying, At least for a 20%+ increase

TFUEL/USDT May-2024Those who joined us on our last TFUEL trade saw us buy in at four cents and exit at the peak! Ready for the next step? Here’s our straightforward plan:
Time to regather your TFUEL and prepare to take profits as mapped on the chart!
Remember, trading success lies in simplicity and smart money management. Stay sharp and focused!

Can #TFUELUSDT Ignite a Bullish Run from the Demand Zone?Yello! Is #ThetaFuel (#TFUELUSDT) poised for a breakout? Let's look at the latest analysis and see what's going to happen next:
💎Currently, #TFUEL is trading within a crucial demand zone, indicating a high probability of a bullish move. The token has been navigating a descending resistance trend for some time, but recent price action shows strong momentum within the $0.066-$0.071 range.
💎This zone is crucial for sustaining momentum. If SEED_DONKEYDAN_MARKET_CAP:TFUEL can maintain its current trajectory, the next target is the key resistance level at $0.115.
💎But what happens if the price fails to hold at the major support between $0.066 and $0.071? In this case, we'll be looking for a retest of the lower support around $0.056. A successful retest here could confirm a robust bullish reversal, setting the stage for a potential breakout above the major support area.
💎However, caution is warranted. If #TFUEL loses momentum and falls below the previous low, this would invalidate the bullish outlook and could lead to a significant price decline.
Keep an eye on these critical levels and be ready for whatever comes next.
MyCryptoParadise
iFeel the success🌴

TFUELUSDT is BullishBullish divergence is playing out as the price has printed a couple of higher highs and a higher low. Bulls are in control of the price action and with no signs of bearish divergence it seems that further highs can be expected. Targets are mentioned on the chart.

TFUELUSDT - BuyBINANCE:TFUELUSDT in bullish trend making HHs and HLs has completed its retracement leg and now aiming for new HH. SL and TPs marked. buy @ CMP or trendline support.

Theta Fuel Ignites - Price Towards $0.16 Resistance?Theta Fuel (TFUEL) has been on a tear this past week, captivating investors with a remarkable surge. After starting in February at a modest $0.04 , TFUEL staged a powerful breakout, shattering its previous resistance level. As of today, April 6, 2024, the price sits comfortably at $0.10 , reflecting a staggering 150% increase in just 2 months.
If it can conquer the $0.16 resistance , it could signal a sustained uptrend. However, even if it encounters a temporary setback, the recent breakout suggests a bullish underlying sentiment that could propel the price higher in the long run.

TFUELReady for Profit? Discover the Potential of TFUEL!
Embark on a journey towards potential profits with TFUEL, a promising asset showing signs of a substantial upswing. After a prolonged accumulation in this range, TFUEL appears to be gearing up for an impressive surge!
Seize the opportunity to enter strategically, ensuring sound money management practices and setting up stops to navigate the unpredictable market dynamics. Rather than predicting the market, let's focus on trading in alignment with the ever-changing price action.
Discipline is the cornerstone of profitability in the financial markets. Our recent trades, especially in SPOT, have demonstrated the effectiveness of a disciplined approach. Fewer trades, strategically executed, can yield massive returns - a key principle in my successful trading strategy.
I'm not seeking followers or popularity; instead, I'm documenting my journey for those who appreciate a record of thoughtful analysis. If you're on board with this trade, share your insights and thoughts. Let's ride the TFUEL train together, and feel free to comment with your thoughts or share your idea! #TFUEL #ProfitOpportunity #TradingJourney #DisciplinePaysOff
