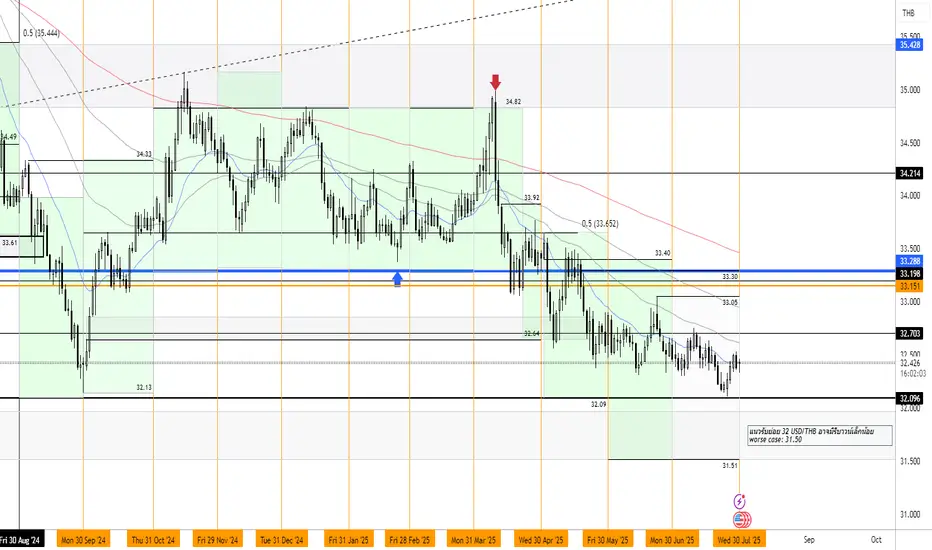
USDTHB 30 July 2025Despite ongoing geopolitical tensions between Thailand and Cambodia, the recent mild depreciation of the Thai baht is largely attributable to dollar strength. Accordingly, we have revised the USD/THB trading range slightly lower.
Monthly Target: 31.50-33.05 thb/usd
Related currencies
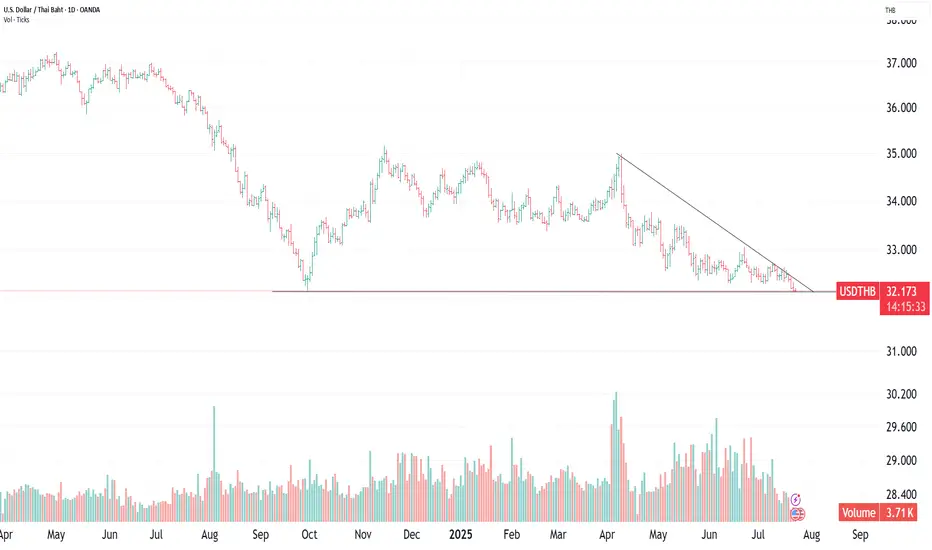
Thai Baht getting strong with volume supporting price trend The Thai baht is getting stronger from increased volume supporting the trend
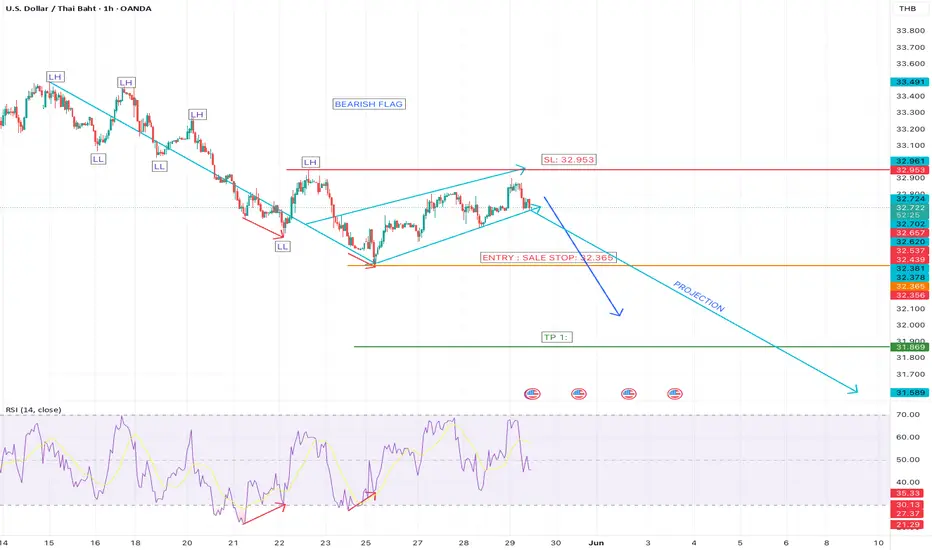
USDTHB SHORT OUTLOOKsame thing as usdchn currency could be testing support areas pretty soon. looking like a bearish movement come come into play. what do you guys think??

Thai Baht getting strong as the weekly MACD already crossed downThe Thai baht should get stronger along with the recent rise in the SET index. The weekly MACD has also already crossed down along with the baht hitting the resistance zone going down to break 33.00 Looking forward to future government stimulus and improved Foreign Direct Investment.

USDTHB 18 June 2025We maintain a bearish view on USD/THB, expecting the Thai baht to appreciate in the medium term over the next 1–3 months.
Monthly Target: 31.50-33.40 thb/usd

USD/THB – Falling Wedge Pattern Detected | Bullish Revel-Week -5Pair: USD/THB
Pattern: Falling Wedge
Trend Shift: Bearish ➡️ Bullish
Bias: Bullish Reversal
🔍 Pattern Breakdown:
USD/THB has been consolidating in a falling wedge, a classic bullish reversal pattern that forms when the price makes lower highs and lower lows — but within converging trendlines.
This

USDTBH LongUSDTBH is now net-long on the regression break.
It is currently in the middle of the range and may move up towards the top over the next couple of weeks.
I am not taking this trade, as it has terrible roll to the long side.

USDTHB Short on Regression BreakUSDTHB has broken the uptrend and put in low high above.
The medium term down trend is build.

WHAT’S FLOWING: INDEX / ENERGY / FX ( USDTHB* ) Today’s “What’s Flowing” highlights shifting market trends across FX, commodities, and indices. The sentiment tags—Bullish, Bearish, or Neutral—provide a high-level view of price action dynamics
📌 Key Market Sentiment Overview
🔵 Indices & Commodities
• US30 (Top Left) – NEUTRAL
• Market stalling

See all ideas
Summarizing what the indicators are suggesting.
Oscillators
Neutral
SellBuy
Strong sellStrong buy
Strong sellSellNeutralBuyStrong buy
Oscillators
Neutral
SellBuy
Strong sellStrong buy
Strong sellSellNeutralBuyStrong buy
Summary
Neutral
SellBuy
Strong sellStrong buy
Strong sellSellNeutralBuyStrong buy
Summary
Neutral
SellBuy
Strong sellStrong buy
Strong sellSellNeutralBuyStrong buy
Summary
Neutral
SellBuy
Strong sellStrong buy
Strong sellSellNeutralBuyStrong buy
Moving Averages
Neutral
SellBuy
Strong sellStrong buy
Strong sellSellNeutralBuyStrong buy
Moving Averages
Neutral
SellBuy
Strong sellStrong buy
Strong sellSellNeutralBuyStrong buy
Displays a symbol's price movements over previous years to identify recurring trends.
Frequently Asked Questions
The current rate of THBUSD is 0.0309 USD — it has increased by 0.29% in the past 24 hours. See more of THBUSD rate dynamics on the detailed chart.
The value of the THBUSD pair is quoted as 1 THB per x USD. For example, if the pair is trading at 1.50, it means it takes 1.5 USD to buy 1 THB.
The term volatility describes the risk related to the changes in an asset's value. THBUSD has the volatility rating of 0.49%. Track all currencies' changes with our live Forex Heatmap and prepare for markets volatility.
The THBUSD showed a −0.03% fall over the past week, the month change is a 0.13% rise, and over the last year it has increased by 9.11%. Track live rate changes on the THBUSD chart.
Learn how you can make money on rate changes in numerous trading ideas created by our community.
Learn how you can make money on rate changes in numerous trading ideas created by our community.
Currencies are usually traded through forex brokers — choose the one that suits your needs and go ahead. You can trade THBUSD right from TradingView charts — just log in to you broker account. Check out the list of our integrated brokers and find the best one for your needs and strategy.
When deciding to buy or sell currency one should keep in mind many factors including current geopolitical situation, interest rates, and other. But before plunging into a deep research, you can start with THBUSD technical analysis. The technical rating for the pair is buy today, but don't forget that markets can be very unstable, so don't stop here. According to our 1 week rating the THBUSD shows the strong buy signal, and 1 month rating is buy. See more of THBUSD technicals for a more comprehensive analysis.