Theta Token Super BullishMy dear reader, an interesting pair and always a big earner is THETABTC, Theta Token.
Here we can see how the October 2023 support was tested recently and it holds, and bullish consolidation has been happening for months above this level.
This bullish wave just mentioned peaked together with Bitcoin in March 2024. Imagine, THETABTC was rising together with Bitcoin as Bitcoin moved to hit 74K.
Right now we have a local higher low, a low in August and a higher low this month, September; today, we have a full green candle; a bullish breakout.
This can be the start of a major bu-wave for this pair.
Lasts year support level was breached on a wick but the market looks strong, we have the possibility of a higher high compared to March on the next bullish jump.
Namaste.
THETABTC trade ideas

THETA/BTC - Theta Network: Super Trend◳◱ On the $THETA/ CRYPTOCAP:BTC chart, the Super Trend pattern suggests indications that the trend may be gaining or losing strength. Traders might observe resistance around 0.00005259 | 0.00005928 | 0.00007199 and support near 0.00003988 | 0.00003386 | 0.00002115. Entering trades at 0.00004774 could be strategic, aiming for the next resistance level.
◰◲ General info :
▣ Name: Theta Network
▣ Rank: 41
▣ Exchanges: Binance, Huobipro, Hitbtc
▣ Category/Sector: Media and Entertainment - Content Creation and Distribution
▣ Overview: The Theta Network is a blockchain protocol for improving the process of creating, streaming, and consuming video content online. Theta Tokens are used in the network to incentivize users to act as peers who share redundant or excess computing and bandwidth resources with other peers. In June 2021, Theta Network added NFTs, e.g. trading cards of media celebrities, to the product portfolio.
◰◲ Technical Metrics :
▣ Mrkt Price: 0.00004774 ₿
▣ 24HVol: 19.208 ₿
▣ 24H Chng: 8.574%
▣ 7-Days Chng: -6.35%
▣ 1-Month Chng: 174.98%
▣ 3-Months Chng: 217.73%
◲◰ Pivot Points - Levels :
◥ Resistance: 0.00005259 | 0.00005928 | 0.00007199
◢ Support: 0.00003988 | 0.00003386 | 0.00002115
◱◳ Indicators recommendation :
▣ Oscillators: BUY
▣ Moving Averages: STRONG_BUY
◰◲ Technical Indicators Summary : BUY
◲◰ Sharpe Ratios :
▣ Last 30D: 8.92
▣ Last 90D: 4.23
▣ Last 1-Y: 1.58
▣ Last 3-Y: 0.25
◲◰ Volatility :
▣ Last 30D: 1.51
▣ Last 90D: 1.17
▣ Last 1-Y: 0.83
▣ Last 3-Y: 1.10
◳◰ Market Sentiment Index :
▣ News sentiment score is N/A
▣ Twitter sentiment score is 0.35 - Bearish
▣ Reddit sentiment score is 0.31 - Bearish
▣ In-depth THETABTC technical analysis on Tradingview TA page
▣ What do you think of this analysis? Share your insights and let's discuss in the comments below. Your like, follow and support would be greatly appreciated!
◲ Disclaimer
Please note that the information and publications provided are for informational purposes only and should not be construed as financial, investment, trading, or any other type of advice or recommendation. We encourage you to conduct your own research and consult with a qualified professional before making any financial decisions. The use of the information provided is solely at your own risk.
▣ Welcome to the home of charting big: TradingView
Benefit from a ton of financial analysis features, instruments and data. Have a look around, and if you do choose to go with an upgraded plan, you'll get up to $30.
Discover it here - affiliate link -

Theta Token 116% Now High ProbabilityClassic signals follow:
➖ Trading above EMA50.
➖ Really high volume.
➖ Very strong RSI.
➖ Rounded bottom.
➖ Full green candle.
➖ Higher lows...
➖ Downtrend broken recently.
➖ Altcoins market bullish.
All these classic signals combined support massive growth.
Short-term and fast, we can see 116%. But you can expect more.
Namaste.


✳️ Theta Token About To Go Up (Over 150% Potential Easy)I only need signal on this chart, for example, why does Theta Token vs Bitcoin (THETABTC) has a strong RSI reading while it trades near All-Time Low?
Because it is about to shoot up with speed.
But there are many more, let me show you:
Trading daily above EMA50.
Bottom cup pattern.
Broke descending channel.
Bullish MACD w/ bullish divergence.
These are classic signals.
These signals work so well that we don't learn anything new, there is no need to because they work most of the time.
Now we just sit back, relax, watch and wait.
The market will take care of the rest.
Namaste.

THETA/BTC - Theta Network: Resistance_Breakout_Confirmation◳◱ An impressive Resistance Breakout and Confirmation has been detected on the MYX:THETA / CRYPTOCAP:BTC chart. The price has surged above a key resistance level, accompanied by a compelling candle pattern, thereby signifying a promising bullish trend. Notable resistance levels can be pinpointed at 0.0000252 | 0.00002652 | 0.00002869, while substantial support zones are identifiable at 0.00002303 | 0.00002218 | 0.00002001. It is highly recommended to seize this opportunity by entering a trade within the present price range of 0.00002546 and setting sights on higher levels of profitability.
◰◲ General info :
▣ Name: Theta Network
▣ Rank: 54
▣ Exchanges: Binance, Huobipro, Hitbtc
▣ Category/Sector: Media and Entertainment - Content Creation and Distribution
▣ Overview: The Theta Network is a blockchain protocol for improving the process of creating, streaming, and consuming video content online. Theta Tokens are used in the network to incentivize users to act as peers who share redundant or excess computing and bandwidth resources with other peers. In June 2021, Theta Network added NFTs, e.g. trading cards of media celebrities, to the product portfolio.
◰◲ Technical Metrics :
▣ Mrkt Price: 0.00002546 ₿
▣ 24HVol: 9.556 ₿
▣ 24H Chng: 2.744%
▣ 7-Days Chng: 7.53%
▣ 1-Month Chng: 19.10%
▣ 3-Months Chng: -32.07%
◲◰ Pivot Points - Levels :
◥ Resistance: 0.0000252 | 0.00002652 | 0.00002869
◢ Support: 0.00002303 | 0.00002218 | 0.00002001
◱◳ Indicators recommendation :
▣ Oscillators: BUY
▣ Moving Averages: STRONG_BUY
◰◲ Technical Indicators Summary : STRONG_BUY
◲◰ Sharpe Ratios :
▣ Last 30D: 3.31
▣ Last 90D: -2.02
▣ Last 1-Y: -0.11
▣ Last 3-Y: 0.86
◲◰ Volatility :
▣ Last 30D: 0.59
▣ Last 90D: 0.64
▣ Last 1-Y: 0.78
▣ Last 3-Y: 1.22
◳◰ Market Sentiment Index :
▣ News sentiment score is N/A
▣ Twitter sentiment score is 0.35 - Bearish
▣ Reddit sentiment score is 0.42 - Bearish
▣ In-depth THETABTC technical analysis on Tradingview TA page
▣ What do you think of this analysis? Share your insights and let's discuss in the comments below. Your like, follow and support would be greatly appreciated!
◲ Disclaimer
Please note that the information and publications provided are for informational purposes only and should not be construed as financial, investment, trading, or any other type of advice or recommendation. We encourage you to conduct your own research and consult with a qualified professional before making any financial decisions. The use of the information provided is solely at your own risk.
▣ Welcome to the home of charting big: TradingView
Benefit from a ton of financial analysis features, instruments and data. Have a look around, and if you do choose to go with an upgraded plan, you'll get up to $30.
Discover it here - affiliate link -


THETA/BTC Bullish scenarioTHETA/BTC looking like it can have a breakout to the upside. The symmetrical triangle can hit either direction but with the correct news and updates we could see an uptrend.

$THETA/#BTC [#Theta Network]: Resistance_Breakout_ConfirmationWe've detected a Resistance Breakout and Confirmation on the $THETA / $BTC chart. The price has broken above a key resistance level and has been confirmed by a strong candle, indicating a potential bullish trend. The next resistance key levels are at 0.0000513 | 0.0000548 | 0.0000628 and the major support zones are respectively at 0.0000433 | 0.0000388 | 0.0000308. We may consider entering a trade at the current price zone at 0.0000495 and targetting higher levels.
Technical Metrics :
Current price: 0.0000495
24H Volume: 10.8504 Ƀ
24H Price change: 3.125%
- Pivot Points - Levels :
Resistance: 0.0000513 | 0.0000548 | 0.0000628
Support: 0.0000433 | 0.0000388 | 0.0000308
Indicators recommandation :
Oscillators: NEUTRAL
Moving Averages: STRONG_BUY
Technical Indicators Summary : BUY
- In-depth THETABTC technical analysis on > Tradingview TA page
What do you think of this analysis? Share your insights and let's discuss in the comments below. Your like, follow and support would be greatly appreciated!
Welcome to the home of charting big: TradingView
Benefit from a ton of financial analysis features, instruments and data. Have a look around, and if you do choose to go with an upgraded plan, you'll get up to $30.
Discover it here

We have a hidden divergence in THETA/BTC - short termHello my friends, I saw a hidden divergence between the momentum indicator and the THETABTC price chart, and on the other hand, the indicators are giving bearish signs. The price of this instrument, if an uptrend wants to move forward based on its hidden divergence, will move up to the moving average of the Alligator indicator, but will return again. The overall and longer-term view is that it will continue in the square and neutral trend.

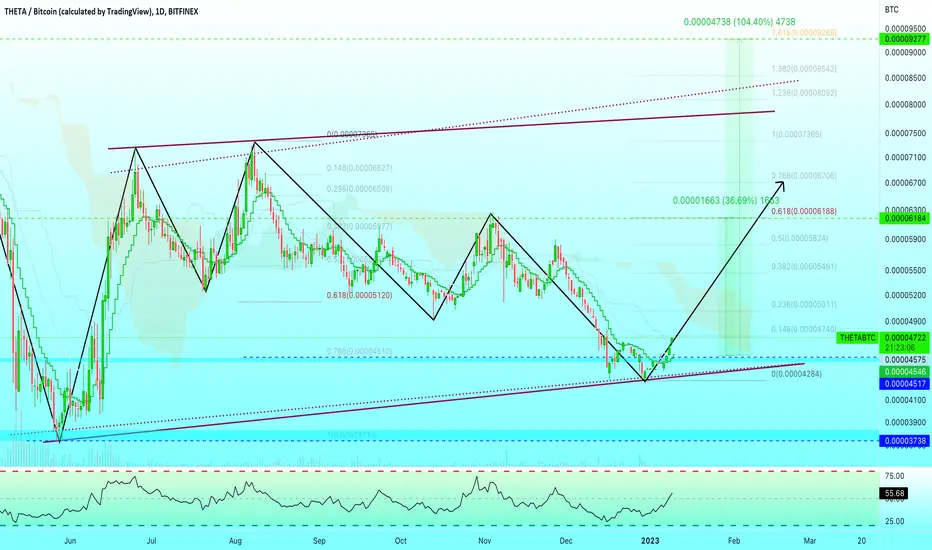
✳️ Theta Token Set To Grow 100%+ vs Bitcoin THETA has an easy path to move upwards with over 100% potential in the coming weeks.
We can see a higher low long-term on this chart, Dec. vs May 2022, and this can lead to a higher high.
This is the THETABTC trading pair.
You can find the targets marked green on the chart while the support levels are marked blue.
Thank you for reading.
Namaste.
Theta coin formed bullish BAT for upto 13% pumpHi dear friends, hope you are well and welcome to the new trade setup of Theta coin with BTC pair.
Previously I shared a long-term trade setup for THETA, which is still in play as below:
Now on a daily time frame, THETA has formed a bullish BAT pattern.
Note: Above idea is for educational purpose only. It is advised to diversify and strictly follow the stop loss, and don't get stuck with trade

Theta Token vs Bitcoin | The Basics & BeyondI am seeing some bullish action but still mixed with weakness...
We will have a better picture in a few days and hopefully things will go towards the bulls, but we can't know for sure.
I have to give you the whole picture.
After the June breakout THETABTC technically remains strong.
The correction took prices as low as 0.618 Fib. retracement which is normal and then bounce up... Still just consolidation so it can go in any direction but the bias mid-term remains bullish based on the late June bullish break.
Short-term we have these last 5 days closing green... But still, the signals are mixed.
We are aiming higher though because we go with the chart.
Let's get more technical:
- We are strongly bullish above 0.00000511.
- Below 511 satoshis the bullish bias remains in play but becomes weaker.
- Even 450 can be tested and all we would say is that patience is key.
We prepare for the worst but hope for the best.
We are looking at the negative side because the bulls right now are ahead.
If there is bullish follow up, nothing to do it just go up.
But if it breaks down, we are prepared...
Always consider all scenarios, this way you know what to do ahead of time.
For example, if this chart breaksdown, would you close at a loss or wait long-term?
This question needs to be answered before you start to trade. :)
Namaste.

$THETAalmost at buy point imo
Rune, Theta, AAVE been missing out on all the fun
guess its time to scale into whatever the next cycle will be for
most likely with Dominance bouncing it'll be bitcoin time
BNB possible candidate .
remember btc pairs could bleed when the King gets going...

theta token trade ideatheta token at verge of breakout buy at pull back for handsome profit .
Note :trade at ur own risk.

Theta Bullish set upThe relative strength of theta against bitcoin could represent an opportunity to add more satoshis to your bag. DYOR

THETA - has broken out against bitcoin !As many altcoins, THETA has just started to outperform bitcoin and has broken out against bitcoin !!
Will be interesting to see how this further develops ....

THETA/BTC - has it bottomed?A subscriber asks a very intriguing question on whether the THETA/BTC chart has bottomed and what this might mean for THETA. Let’s look at the chart.
We can see what looks to be a completed correction, with an ABC pattern finishing with a compound ABCDE correction in the C-wave. This has formed a double bottom on the 0.786 Fibonacci projection of the A-wave from B, confirming this level as support and pushing price towards the upper resistance line of the declining wedge formation. A break of this line to the upside, once confirmed, should see appreciation in the THETA/BTC pairing. That is, THETA will begin outperforming BTC once again in this scenario.
However, that does not mean the correction in THETA/USDT is necessarily over, just that declines in BTC would be more significant.
What do you think? Has THETA turned the corner in its BTC declines?

Theta Token Reaches Support, Will It Bounce?We have the Theta Token (THETABTC) altcoin trading pair on screen, let's see what's up.
The low level hit on 22-Jan. 2022 turns out to be the 0.786 Fib. retracement level for the bullish wave starting March 2020, this is a strong support level where bounces and reversal tend to take place.
Now, if you were to look at the weekly chart it is easy to see that there is still plenty of room left for additional correction but now that this Fib. level has been hit, we can look for at least a bounce to show up, this is marked with a blue arrow on the chart.
Seeing that TFUELBTC already went above EMA50, this one is likely to follow.
The light blue rectangles denote support levels.
This one can be good but there are better charts.
Chart setups with less risk and higher potential reward.
This is not financial advice.
Namaste.

THETABTC is creating a descending channelThe price retraced more than 80% since his double top.
On the daily timeframe, the market created a double top and now is creating a descending channel.
We are monitoring the price for a breakout of 0.0000880.
How to approach?
IF the price is going to have a breakout from the descending channel with Volume, According to Plancton's strategy , we can set a nice order
–––––
Keep in mind.
🟣 Purple structure -> Monthly structure.
🔴 Red structure -> Weekly structure.
🔵 Blue structure -> Daily structure.
🟡 Yellow structure -> 4h structure.
–––––
Follow the Shrimp 🦐

THETA/BTC Huge Falling Wedge Promises 3.7X Return Minimal Risk BINANCE:THETABTC is in a falling wedge since March of last year. It has broken off the top of the wedge on 24 December and has just touched the top of the structure. I'm betting that this is a retest and that it will reverse upwards from here.
Points in favor of this trade:
- The falling wedge structure is solid.
- We are retesting the downward trendline after breaking it.
- We are at the support line of 754 Satoshis which has historic significance.
Points Against:
- No RSI divergence. We need to see a lower low in price with a higher low in RSI.
- We haven't seen a reversal candle yet.
- No clear indicator on where to place the stop loss.
I would place the stop loss at 20% below the support line because crypto... For the record, this is not good enough of a reason.
Trade carefully and good luck.
Oh and also, I have NO IDEA what Theta is. This is only a technical trade. No fundamentals involved.

THETABTC - SETUPTHETABTC price holding the support zone since last week. There is a bullish engulfing candle formed and the price holds the EMA 21 level, So we are expecting the bulls will take control after breaking the trendline and pull the price towards the 0.01300 level again. Good Luck!

THETA breaking off btc?After a months long descending triangle, THETA Network seems to be breaking away from BTC. This token has been like an annoying little brother to BTC since May. Is the token finally growing up? Possible retest, but break-up seems imminent.
