THETA - Cup & HandleMorning fellas,
Refer to my last Cup & Handle catch, played out beautifully.
Looks like THETA / USDT could do the same.
Im long, are you?
Trade thirsty.
NFA
THETAUSDT trade ideas

Theta Token: Your Altcoin ChoiceTheta Token has undergone a major correction, one that started in March 2024. Conditions are good for this chart based on the structure of this correction, it is reaching its end, but also a long-term higher low, really long.
THETAUSDT bottomed first in September 2023. The higher low comes in now, in April 2025. That's a year and seven months.
Easy target is a higher high compared to years of action, yielding a nice 590% potential for profits. But this would be mid-term but for the full bull market there should be more.
Super easy and short-term would be the 0.618 Fibonacci extension level around $2.31 for 216%. Both these targets are clearly mapped on the chart.
The correction higher low is now sitting within a long-term support, the buy zone. This is the space marked green on the chart. Each time THETAUSDT activates this level, a period of growth follows.
As seen in the past, once our long-term support and buy zone is activated growth doesn't necessarily start right away. Nothing happens within a single day. The pair/project can start growing producing higher highs and higher lows, but there can be a build up process that takes months. Think back of 2024. Many Altcoins bottomed in August and started to grow, but it took until November for the strong bullish jump. This time around it can be the same. Strong growth, but it takes time for bullish momentum to accumulate.
It is easy to wait with such a pair. The market can take as long as it needs because 500% profits is simply great. Imagine, or focus, or calculate based on 1-2 months of slow and steady growth, and then a strong bullish jump. Of course, there can be variations to this projection, but this is only the map, the map is not the territory.
Conclusion: Crypto is set to grow.
It doesn't matter if the next bullish wave shows up within weeks or days. The time to buy is now. Buy forever more and then just wait. Wait patiently. Books, read books and prepare. Be ready because this opportunity only presents itself every four years. We have to make the maximum of it. We have to accept what the market has to give. We have to secure profits at the right time. We have to extract some savings, pay our debts or do whatever it is we want to do once we achieve financial success.
When everything is green, do not fall sleep.
When everything is up, do not become complacent and continue to hold.
We hold now, when prices are low. When prices are high, that's the time to secure profits.
Thanks a lot for your support.
Namaste.

THETA/USDT-12H-BINANCEbullish three pushes-divergence
This is not a financial advice. Always do your own research and always put stoploss in your trade (SL) :) If you want more detailed info
how to study and read charts or just need help with some coin, just write to me here a comment, i will try to answer to everybody...
i can help you :) all for free, don't worry, BE HAPPY!

theta buy midterm "🌟 Welcome to Golden Candle! 🌟
We're a team of 📈 passionate traders 📉 who love sharing our 🔍 technical analysis insights 🔎 with the TradingView community. 🌎
Our goal is to provide 💡 valuable perspectives 💡 on market trends and patterns, but 🚫 please note that our analyses are not intended as buy or sell recommendations. 🚫
Instead, they reflect our own 💭 personal attitudes and thoughts. 💭
Follow along and 📚 learn 📚 from our analyses! 📊💡"

THETAUSDT 1WTHETA ~ 1W Analysis
#THETA Buy gradually from here with a short -term target of at least 20%+ from here.

THETA USD LONG Theta Price has formed a Rising wedge pattern both in 1HTF & 4HTF which is a strong sign of Bullish Momentum building. Although in DTF it's a falling channel ranging, but a strong breakout from the ascending Wedges may also indicate a trend reversal to new levels.
But in the main time, this is our setup.

Will THETA return to an upward trend?Hello everyone, I invite you to review the current situation on Theta Token. When we enter the one-day interval, we can see how the price moved in the formed downtrend channel. What's more, we can see here the movement at the lower border of the channel and how the price maintains a strong support at the level of $ 0.90, however, if we go lower, just below the channel border, a very strong support zone for the price from $ 0.69 to $ 0.42 is visible.
We can also see how the price enters a slight sideways trend in which it can approach the downtrend line lasting inside the downtrend channel, such consolidation and gathering of energy can have a positive impact on the movement in the coming weeks, which can lead to growth. When such a scenario works, we can see a nice upward movement around $ 1.36, another significant resistance can be seen at $ 1.75, and then we have strong resistance around $ 2.36.
It is worth paying attention to the MACD indicator here, which shows how we are staying in the lower range and the ongoing movement is visible here, which may also indicate a potential attempt to rebound the price.

THETAUSDT 1W🩸 MYX:THETA ⁀➷
#ThetaNetwork. Macro chart Another
💯 Intermediate Target - $4.00
🚩 Macro Target 1 - $5.50
🚩 Macro Target 2 - $8.44
🚩 Macro Target 3 - $12.28
- Not financial advice, trade with caution.
#Crypto #ThetaNetwork #THETA #Investment
✅ Stay updated on market news and developments that may influence the price of ThetaNetwork. Positive or negative news can significantly impact the cryptocurrency's value.
✅ Exercise patience and discipline when executing your trading plan. Avoid making impulsive decisions driven by emotions, and adhere to your strategy even during periods of market volatility.
✅ Remember that trading always involves risk, and there are no guarantees of profit. Conduct thorough research, analyze market conditions, and be prepared for various scenarios. Trade only with funds you can afford to lose and avoid excessive risk-taking.

theta sell midterm "🌟 Welcome to Golden Candle! 🌟
We're a team of 📈 passionate traders 📉 who love sharing our 🔍 technical analysis insights 🔎 with the TradingView community. 🌎
Our goal is to provide 💡 valuable perspectives 💡 on market trends and patterns, but 🚫 please note that our analyses are not intended as buy or sell recommendations. 🚫
Instead, they reflect our own 💭 personal attitudes and thoughts. 💭
Follow along and 📚 learn 📚 from our analyses! 📊💡"

Theta daily timeframe bullish divergence RSI bullish divergence works very well on daily timeframe. Theta will pump well from here. Keep eye on it
THETAUSDT 1WTHETA ~ 1W Analysis
#THETA Buy from here if you still have a Conviction on this coin with a minimum target of 20%+.

theta midterm buy "🌟 Welcome to Golden Candle! 🌟
We're a team of 📈 passionate traders 📉 who love sharing our 🔍 technical analysis insights 🔎 with the TradingView community. 🌎
Our goal is to provide 💡 valuable perspectives 💡 on market trends and patterns, but 🚫 please note that our analyses are not intended as buy or sell recommendations. 🚫
Instead, they reflect our own 💭 personal attitudes and thoughts. 💭
Follow along and 📚 learn 📚 from our analyses! 📊💡"

THETA update#THETA made a triangle as a correction wave this triangle should have 5 waves as ABCDE waves now the E wave is completed now we have 2 scenarios
once is rising from here but it will be confirmed after crossing confirmation line
the other scenario is to go down and make the C wave and make a rise after that
check out my last analysis on this coin

THETA is going to rise soon !#THETA made a clear triangle with ABCDE and this means that we need one more descending wave after that it hit the demand zone
in higher time frames we have a clear bullish pattern so i can be sure that it will rise in long term
and in short time frames
so we are close to the bullish phase !

THETA Token Perspective and Potential Gains - Cup & HandleTheta token seems to be creating a bottoming pattern , compressed into a Cup & Handle shape . I’m looking for a breakout above the $3.7 resistance level to confirm this bullish setup.
Currently, Theta is trading around $2.0 , which acts as a temporary support zone . However, it’s important to stay cautious — if the price drops below $1.5 , it could lead to a structure failure , invalidating this perspective.
Key Levels to Watch:
Cup & Handle Breakout Level: $3.7
Targets: $5 - $7 - $8 - $10
Let’s see how this plays out — breakouts from these patterns often gives great opportunities.

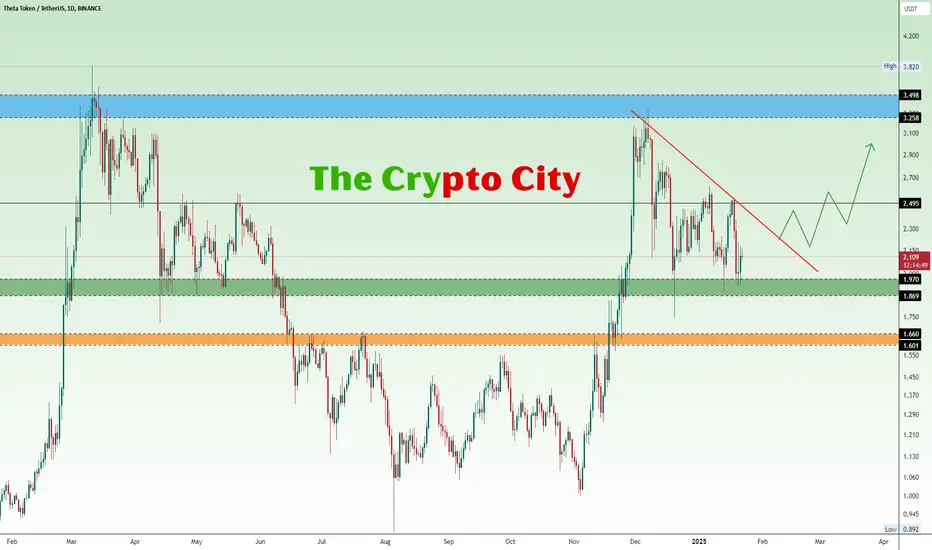
THETA Poised for a Major BreakoutTHETA is currently resting on a critical support zone (Green) at $1.869–$1.970, a level that has previously sparked significant bullish momentum. However, the price remains constrained by a descending trendline that has acted as stubborn resistance for weeks. The next move will be crucial in determining whether THETA continues its downtrend or reverses into a bullish rally.
If the Green support holds and the price breaks above the descending trendline, an upside move toward the $2.495 resistance level is likely. A break above this level could set the stage for a rally to the Blue resistance zone at $3.258–$3.498, especially if accompanied by strong volume and momentum.
On the downside, if the Green support fails, THETA could drop toward the Yellow support zone at $1.601–$1.660, where a pool of liquidity might trigger a bullish rebound.
THETA long term analysis updatei made an analysis on this coin weeks ago the main pattern is not changed these is a selling pressure on this coin when it touches the VWAP indicator but it made a perfect pattern for rising we have to wait for the last drop and after that the market will insanely rise !

theta long sell limit"🌟 Welcome to Golden Candle! 🌟
We're a team of 📈 passionate traders 📉 who love sharing our 🔍 technical analysis insights 🔎 with the TradingView community. 🌎
Our goal is to provide 💡 valuable perspectives 💡 on market trends and patterns, but 🚫 please note that our analyses are not intended as buy or sell recommendations. 🚫
Instead, they reflect our own 💭 personal attitudes and thoughts. 💭
Follow along and 📚 learn 📚 from our analyses! 📊💡"

THETA update#THETA made a clear triangle with 5 waves this means that the market needs to make another drop as wave C
after finishing this ABC pattern the market is ready to rise here you can see that this coin has a positive patttern for long term

THETAUSDT at a Crossroads: Breakout or Breakdown Ahead?Yello, Paradisers! Is THETAUSDT gearing up for a massive breakout or bracing for a sharp breakdown? Here's what you need to know right now.
💎#THETAUSD is currently sitting at a critical support level of $1.863 an area that has previously ignited significant bullish momentum. However, the price continues to struggle to break above the descending trendline, which has acted as a stubborn resistance for weeks. This makes the next move pivotal in determining whether we’re heading for a continuation of the downward trend or a reversal into a bullish rally.
💎If the bulls defend the $1.863 support zone and successfully break above the descending trendline, we could see an upside move toward the resistance zone at $2.60–$2.80. Beyond that, the next target sits at the resistance area of $3.48, which could trigger a substantial rally if supported by strong volume and momentum.
💎However, if the $1.863 support fails to hold, #THETANETWORK could slide toward the $1.570 demand zone, where there is a pool of liquidity that may prompt a bullish rebound. That said, a clean break below this demand zone would invalidate bullish scenarios, opening the door for further bearish pressure that could drive the price even lower.
Paradisers, stay sharp and disciplined! The market is brimming with both opportunities and risks, but only those who wait patiently for high-probability setups will thrive. Whether you’re leaning bullish or bearish, tight stop-losses and proper risk management are non-negotiable.
MyCryptoParadise
iFeel the success🌴

$THETA possible breakoutTheta can actually break out the resistance, RSI is looking good on the daily.
I'm expecting a good run from here on.
Not financial advice.


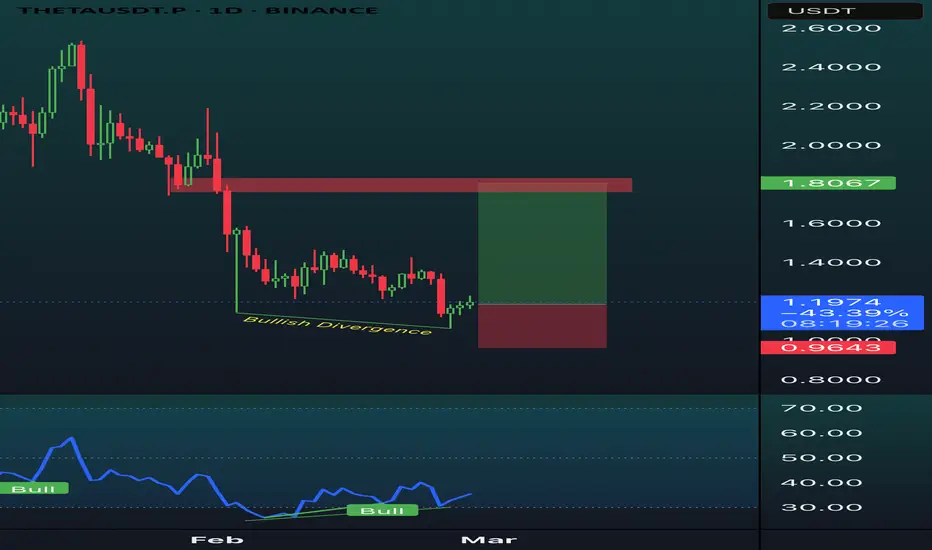
Massive Volume Spike This Blue Box Could Be the Game Changer!THETAUSDT: Massive Volume Spike—This Blue Box Could Be the Game Changer! 🚀
Ladies and gentlemen, we’re looking at a 229% daily volume spike . That’s big, really big. When you see numbers like this, you know there’s something brewing under the surface. The question is, are you ready to act?
Here’s the plan for THETAUSDT:
Blue Box Buy Zone: This is where the magic happens. It’s carefully identified as the area where buyers could step in aggressively.
Volume Surge Means Opportunity: A volume increase of this size doesn’t happen by accident. It’s a sign that the big players are getting involved, and we’re here to ride their wave.
Lower Timeframe Confirmation: I’ll wait for bullish market structure breaks on the 1H chart before entering. Tools like CDV, volume profile, and liquidity heatmaps will guide the final decision.
This is not just a trade—it’s a statement. The market doesn’t hand out opportunities like this every day. Take action, be decisive, and don’t let this slip by. Boost, comment, follow—and let’s crush it! 💥
Let me tell you, this is something special. These insights, these setups—they’re not just good; they’re game-changers. I've spent years refining my approach, and the results speak for themselves. People are always asking, "How do you spot these opportunities?" It’s simple: experience, clarity, and a focus on high-probability moves.
Want to know how I use heatmaps, cumulative volume delta, and volume footprint techniques to find demand zones with precision? I’m happy to share—just send me a message. No cost, no catch. I believe in helping people make smarter decisions.
Here are some of my recent analyses. Each one highlights key opportunities:
🚀 RENDERUSDT: Strategic Support Zones at the Blue Boxes +%45 Reaction
🎯 PUNDIXUSDT: Huge Opportunity | 250% Volume Spike - %60 Reaction Sniper Entry
🌐 CryptoMarkets TOTAL2: Support Zone
🚀 GMTUSDT: %35 FAST REJECTION FROM THE RED BOX
🎯 ZENUSDT.P: Patience & Profitability | %230 Reaction from the Sniper Entry
🐶 DOGEUSDT.P: Next Move
🎨 RENDERUSDT.P: Opportunity of the Month
💎 ETHUSDT.P: Where to Retrace
🟢 BNBUSDT.P: Potential Surge
📊 BTC Dominance: Reaction Zone
🌊 WAVESUSDT.P: Demand Zone Potential
🟣 UNIUSDT.P: Long-Term Trade
🔵 XRPUSDT.P: Entry Zones
🔗 LINKUSDT.P: Follow The River
📈 BTCUSDT.P: Two Key Demand Zones
🟩 POLUSDT: Bullish Momentum
🌟 PENDLEUSDT.P: Where Opportunity Meets Precision
🔥 BTCUSDT.P: Liquidation of Highly Leveraged Longs
🌊 SOLUSDT.P: SOL's Dip - Your Opportunity
🐸 1000PEPEUSDT.P: Prime Bounce Zone Unlocked
🚀 ETHUSDT.P: Set to Explode - Don't Miss This Game Changer
🤖 IQUSDT: Smart Plan
⚡️ PONDUSDT: A Trade Not Taken Is Better Than a Losing One
💼 STMXUSDT: 2 Buying Areas
🐢 TURBOUSDT: Buy Zones and Buyer Presence
🌍 ICPUSDT.P: Massive Upside Potential | Check the Trade Update For Seeing Results
🟠 IDEXUSDT: Spot Buy Area | %26 Profit if You Trade with MSB
📌 USUALUSDT: Buyers Are Active + %70 Profit in Total
🌟 FORTHUSDT: Sniper Entry +%26 Reaction
🐳 QKCUSDT: Sniper Entry +%57 Reaction
📊 BTC.D: Retest of Key Area Highly Likely
This list? It’s just a small piece of what I’ve been working on. There’s so much more. Go check my profile, see the results for yourself. My goal is simple: provide value and help you win. If you’ve got questions, I’ve got answers. Let’s get to work!
