THETAUSDT trade ideas


THETA High Probability Continuation Trade 👇Whats Up Retail Whales 🐋
Before we start to discuss, id be so glad if you share your opinion on this post's comment section and hit the like button if you gained value!
Looking to swing trade #THETA down into our 4Hr Whale Block here. Happy to be following LTF trend with a pullback into Discount Pricing.
Method of Entry will follow our Retail Whale Trading Plan
-Whale Block Mitigation
-LTF BOS
-Strong RSI Divergence
-Entry on a HA Shaved Candle
Its always the same, following the plan
1:4 R:R
Remember we are trading human emotions and probabilities
Hope you enjoy the content we create, You can support us with your likes and cheers 🙏🙏
❗️Attention: this isn't financial advice we are just trying to help people with their vision.
HooRaa

THETA TOKEN / TETHERUSConsidering the decrease of momentum in the range specified in the 4-hour chart, we can expect the price to decrease to the range of 1.3

Theta Darvas Box BreakoutTheta broke out on a weekly time from Darvas box. I am expecting a 40% or more pump.

THETAUSDTHELLO trades!
On the 4H time frame we have a head and shoulders pattern , yes indeed a good signe cause from here the price decides where it wants to go next.
what i mean is , sometimes price doesn't break the support level(the neck line) and continues to the upside , but if it does we know very well how to profit from this chart pattern!
not a trading advice trade on your own RISK!!!!!
Give me like if you are agree and let me know what you think in the comment!
its nice to have different ideas

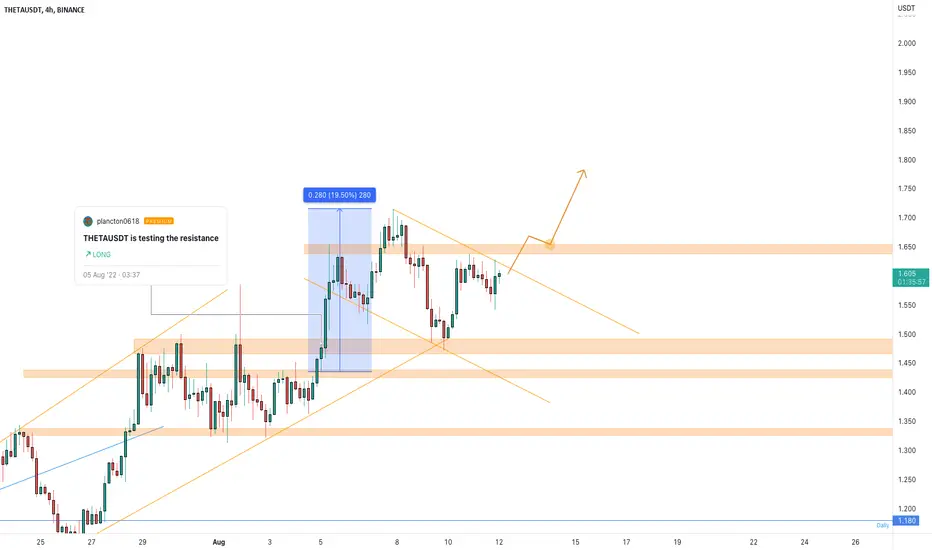
THETAUSDT is creating a Descending channelThe price is creating a descending channel below the 1.650$ where the market created a 4h resistance.
We made more than 19% since my previous idea, and the price needs to create a new breakout to continue its uptrend.
How to approach it?
IF the price is going to have a breakout and retest the 4h resistance as new support, According to Plancton's strategy , we can set a nice order
–––––
Keep in mind.
🟣 Purple structure -> Monthly structure.
🔴 Red structure -> Weekly structure.
🔵 Blue structure -> Daily structure.
🟡 Yellow structure -> 4h structure.
–––––
Follow the Shrimp 🦐
THETAUSDT:D1Hello friends
📉Based on the chart: Important levels are marked
.We also expect movement: the size of the width of the broken range
.📢 Please follow your strategy, , this is just my idea
.🙌Please do not forget the ' like' button & Share it with your friends
.✍ I will be glad to see your ideas in this post.
.🧲Follow me to see more analysis

theta 30 min divergenceIn the 30-minute time frame, it is on the upward support, and it also has a divergence to become downward, like the chart, if it wants to break from either side, we will open a trade in the same direction.
Thanks


Theta token forecast and signalPlease write any advice or suggestions.
Dear friends, request any cryptocurrency pair, currencies pair for forex, and any index that you want to be analyzed and ask any questions.
Thanks for your attention

Not a bad idea to start buying $THETA.Massive descending wedge forming on HTF charts for $THETA. Looks like it is being accumulated right now and a clear bullish RSI divergence adds confluence. ~$2.25 could be a short term target but I am in it for the long term.

This shit Look good.Hey there theta is looking good because no more resistance anymore towards to 1.87 and fib levels support this area is good for long way.
Its not financial advice just for education.

Inverse Head and shoulderSo far so good it's looking like an inverse heads and shoulders pattern about to play out. Get your long trades ready!

BIG.. THETA move ??? Maybe... Good luck everyone 😀 Accumulation Wyckoff Event
Possible move out of accumulation for THETA coming...
Good luck everyone...

THETA - THETAUSDT-Scalping 🎧
#THETA
- Scalping Excellent short selling area - #THETAUSDT - quick trade

THETA#THETA #Wyckoff
- CRAB 🦀
- Daily Frame
#This is my technical opinion and not a recommendation to buy or sell


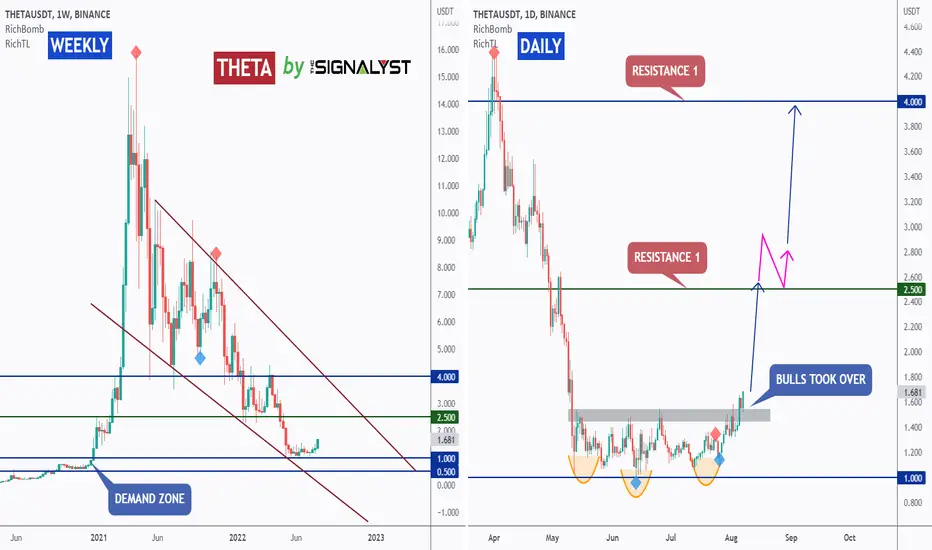
THETA - Bulls Took Over! Target => 🎯Hello TradingView Family / Fellow Traders. This is Richard, as known as theSignalyst.
Weekly: Left Chart
THETA rejected a strong demand zone and round number 1.0 so we will be looking for buy setups on lower timeframes.
Daily: Right Chart
on DAILY: THETA formed a valid inverse head and shoulders and the bulls took over after a momentum candle close above the gray neckline.
🎯 Targets => Our first resistance / target would be around 2.5 so I will be monitoring price action there.
If we break it upward (purple projection) then a movement till 4.0 would be expected.
Always follow your trading plan regarding entry, risk management, and trade management.
Good luck!
All Strategies Are Good; If Managed Properly!
~Rich
THETAUSDT Buy Signal!THETAUSDT Techncical analysis update
THETA breakout its resistance zone after 3 months of a ranging market.
Buy zone: $1.59 - $1.66
Stop loss : $1.45
Target 1 : $1.79
Target 2 : $1.97
Target 3 : $2.25
Always keep stop
Thanks
Hexa


Theta - Perfect Trade opportunityBuy the retest and keep stop loss below the yellow line. Risk free trade and profit will 115%, if it goes in the right direction. worth taking risk

THETA break a resistance level in usdt pairTHETA analysis:
#THETAUSDT broke the major resistance level and now retesting it. If THETA able to hold the $1.53-$1.55 level then we see a good rally. You can open long positions near $1.53-$1.55 with stop loss.
Targets: $1.72 - $1.90 - $2.27 - ..
