Did the Black Swan prophets take note?The stock market crash of March/April 2025 looks almost like an exact replica of the COVID crash.
NAS100 trade ideas

A Look at Nasdaq Buyers around the $21.5k .Looks like Nasdaq buyers took a breather at the $21.5k level. Time to watch if the market flutters back up like a butterfly or dives deeper. 🦋📉

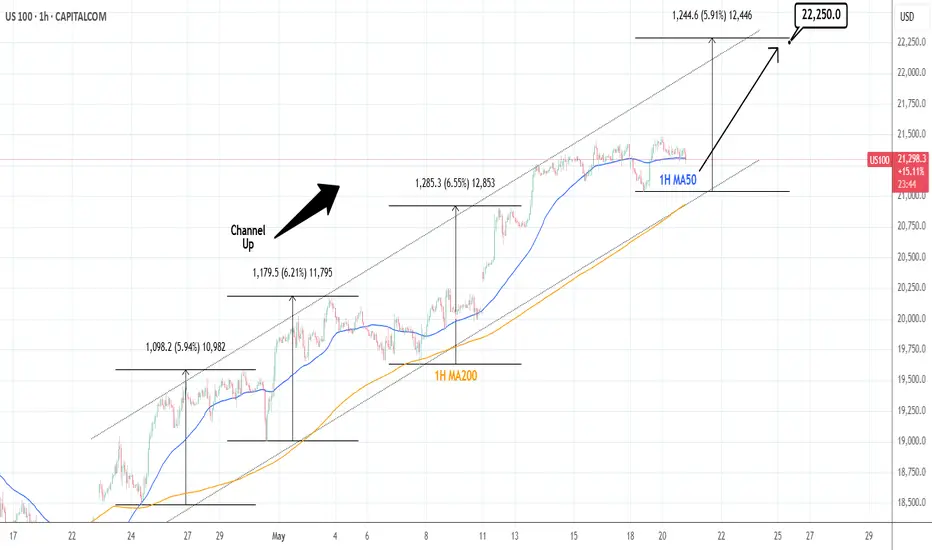
NASDAQ: Channel Up to soon initate the new bullish wave.Nasdaq is bullish on its 1D technical outlook (RSI = 67.876, MACD = 566.960, ADX = 50.516) as it is still holding the Channel Up of almost 1 month back, whose support is the 1H MA200. Right now the price is consolidating around the 1H MA50, approaching the bottom of the pattern. Once it does, we expect it to initate the new bullish wave. With the shortest one of the Channel Up being +5.90%, we remain bullish here and look towards a TP = 22,250 by early next week.
## If you like our free content follow our profile to get more daily ideas. ##
## Comments and likes are greatly appreciated. ##
NAS100 - Buy Trade - 20/05/2025Fundamentals: The Nasdaq 100 index has rallied, with strong earnings keeping stock-market bulls in charge.
Technical: Bullish momentum persists, with resistance at 21,500 and support at 21,200.


THIS IS WHAT I'M LOOKING FOR TODAYIt would be nice if we get the low of the Day during London Session. then we can find a Nice entry During New York open.

Nasdaq-100 H1 | Pullback support at 23.6% Fibonacci retracementNasdaq-100 (NAS100) is falling towards a pullback support and could potentially bounce off this level to climb higher.
Buy entry is at 20,898.76 which is a pullback support that aligns with the 23.6% Fibonacci retracement.
Stop loss is at 20,500.00 which is a level that lies underneath a swing-low support and the 38.2% Fibonacci retracement.
Take profit is at 21,471.38 which is a swing-high resistance.
High Risk Investment Warning
Trading Forex/CFDs on margin carries a high level of risk and may not be suitable for all investors. Leverage can work against you.
Stratos Markets Limited (tradu.com):
CFDs are complex instruments and come with a high risk of losing money rapidly due to leverage. 63% of retail investor accounts lose money when trading CFDs with this provider. You should consider whether you understand how CFDs work and whether you can afford to take the high risk of losing your money.
Stratos Europe Ltd (tradu.com):
CFDs are complex instruments and come with a high risk of losing money rapidly due to leverage. 63% of retail investor accounts lose money when trading CFDs with this provider. You should consider whether you understand how CFDs work and whether you can afford to take the high risk of losing your money.
Stratos Global LLC (tradu.com):
Losses can exceed deposits.
Please be advised that the information presented on TradingView is provided to Tradu (‘Company’, ‘we’) by a third-party provider (‘TFA Global Pte Ltd’). Please be reminded that you are solely responsible for the trading decisions on your account. There is a very high degree of risk involved in trading. Any information and/or content is intended entirely for research, educational and informational purposes only and does not constitute investment or consultation advice or investment strategy. The information is not tailored to the investment needs of any specific person and therefore does not involve a consideration of any of the investment objectives, financial situation or needs of any viewer that may receive it. Kindly also note that past performance is not a reliable indicator of future results. Actual results may differ materially from those anticipated in forward-looking or past performance statements. We assume no liability as to the accuracy or completeness of any of the information and/or content provided herein and the Company cannot be held responsible for any omission, mistake nor for any loss or damage including without limitation to any loss of profit which may arise from reliance on any information supplied by TFA Global Pte Ltd.
The speaker(s) is neither an employee, agent nor representative of Tradu and is therefore acting independently. The opinions given are their own, constitute general market commentary, and do not constitute the opinion or advice of Tradu or any form of personal or investment advice. Tradu neither endorses nor guarantees offerings of third-party speakers, nor is Tradu responsible for the content, veracity or opinions of third-party speakers, presenters or participants.

Nasdaq Short: Try again with Fibonacci Level HelpThis idea is complementary to the S&P500 short.
This is also an idea to try shorting again on the same trading session after the first hit stop loss.

US100 expectation 1HStrong bullish movement being supported by many confirmations, from a good channel, to a few broken resistance's, and new highs drawing buyers in to pump it up.

NAS100 Bulls Pushing – Will 21,434 Hold or Crack?Price is currently trading just below the 21,434 🔼 resistance zone, after a strong bullish push that followed the reclaim of the 21,000 🔽 support area. The index is forming a short-term range between these two key zones. The overall structure remains bullish with a series of higher highs and higher lows.
Support at: 21,000 🔽, 20,606 🔽, 20,200 🔽
Resistance at: 21,434 🔼, 22,230 🔼
Bias:
🔼 Bullish: A breakout and retest above 21,434 could open the path toward the 22,230 high. Bulls remain in control while price holds above 21,000.
🔽 Bearish: A rejection at 21,434 or a break below 21,000 could lead to a correction toward 20,606 or 20,200.
📛 Disclaimer: This is not financial advice. Trade at your own risk.

Nasdaq Short: Completion of 5 wavesThis is a tactical short (short-term in nature) as I see a 5-wave completion structure.

X2: NQ/US100/NAS100 Short - Day Trades 1:2 RRX2:
Risking 1% to make 2%
NAS100, US100, NQ, NASDAQ short for day trade, with my back testing of this strategy, it hits multiple possible take profits, manage your position accordingly.
Risking 1% to make 2%
Use proper risk management
Looks like good trade.
Lets monitor.
Use proper risk management.
Disclaimer: only idea, not advice

NAS 100 I Cautiously Bullish Welcome back! Let me know your thoughts in the comments!
** NAS100 Analysis - Listen to video!
We recommend that you keep this pair on your watchlist and enter when the entry criteria of your strategy is met.
Please support this idea with a LIKE and COMMENT if you find it useful and Click "Follow" on our profile if you'd like these trade ideas delivered straight to your email in the future.
Thanks for your continued support!Welcome back! Let me know your thoughts in the comments!

NASDAQ (Possible Move Up Incoming)
Traders, keep an eye on NASDAQ — the trend has shifted, and price is currently in a corrective phase. As it approaches my key buy area (now acting as support), I anticipate bullish momentum to build, potentially pushing price toward a new all-time high.

Is NASDAQ ready to correct for a few days?We have a couple of doji candles on the daily chart forming out of a bearish imbalance range in the relative premium. This is the perfect place to test the lows for stops.
We are still bullish but I am going to go neutral for this forecast in anticipation of a slight correction.
Share this with someone who needs a complete top down analysis of where we are staring this week!

us100 shortcredit rating drop, bonds up, us 100 might have next leg down, seems nice RR, will give it a shot.
