Nasdaq 100 Bearish Divergence Signals Potential 30% down ?Chart Analysis (Monthly):
The Nasdaq 100 (NDX) is showing a significant bearish divergence on the monthly chart with RSI, which historically has been a strong reversal signal. While the price has recently made a new high, the RSI has failed to confirm this move, forming lower highs. This divergence typically precedes major corrections in the index. Similar patters have been observed on S&P 500 and FANG+ Index.
Historical Context:
In past instances (highlighted on the chart), similar divergences led to substantial declines:
2018: ~23% drop
2022: ~37% drop
Currently, if history repeats, the NDX could potentially correct by ~30% from recent highs, bringing it closer to the 16,000–17,000 zone, aligning with the previous demand zone and the 100-month moving average.
Fundamental Backdrop – Tariff Issues:
Adding to the technical weakness, renewed concerns over U.S. trade tariffs under Trump's policy stance are resurfacing. Potential escalation in tariffs could weigh heavily on mega-cap tech stocks, which dominate NDX, impacting global supply chains and margins. Historically, tariff-related uncertainty has triggered volatility in growth-heavy sectors.
Watchlist Action:
Closely monitor upcoming U.S. trade policy announcements and tariff discussions.
Hedge long positions or consider selective short opportunities if bearish confirmation patterns appear on weekly/daily timeframes.
📌 Disclaimer: This analysis is for educational purposes only and does not constitute financial advice.
NAS100 trade ideas

NAS100 Hits Monthly Level - Retrace or Reload?After a sharp leg down, NAS100 remains in a broader uptrend but is now reacting off a key monthly level. Expect a short-term retracement with the potential for a second leg lower. If bullish momentum returns, watch for an attempt to reclaim the level. Momentum is strong enough to challenge it again—traders should be ready for either a deep retrace or continuation move.
NAS100 - Potential Targets this WeekDear Friends in Trading,
How I see it,
(My week is building up; I'm using the DATA we have thus far)
Keynotes:
510k orders stacked at the current demand area.
If sellers push through Daily support decisively, it will become a strong resistance.
The real battlefield between sellers and buyer lies between 23250 - 23500.
Remember with stocks, Imbalances can remain unfilled for very long periods.
I sincerely hope my point of view offers a valued insight
Thank you for taking the time study my analysis.

Sunday Premarket AnalysisWe will likely hit the 4H FVG not too far above where price left off on Friday.
Then head all the way down take July's low and hit the area below that
because there is a BIG FAT juicy MONTHLY, WEEKLY && DAILY FVG
sitting directly under the July monthly low. We will likely hit all three or maybe just 2
of these FVG's and then head up for super big push, bullish into at least the first week of September. Keep in mind Jackson Hole Symposium is mid month-ish also.

NSDQ100 The Week Ahead Key Support and Resistance Levels
Resistance Level 1: 23050
Resistance Level 2: 43190
Resistance Level 3: 43430
Support Level 1: 22500
Support Level 2: 22333
Support Level 3: 22080
This communication is for informational purposes only and should not be viewed as any form of recommendation as to a particular course of action or as investment advice. It is not intended as an offer or solicitation for the purchase or sale of any financial instrument or as an official confirmation of any transaction. Opinions, estimates and assumptions expressed herein are made as of the date of this communication and are subject to change without notice. This communication has been prepared based upon information, including market prices, data and other information, believed to be reliable; however, Trade Nation does not warrant its completeness or accuracy. All market prices and market data contained in or attached to this communication are indicative and subject to change without notice.

NAS100 - The Stench of Insider Trading on Colossal Scale!!Dear Friends in Trading,
How I see it,
This is just my observation on 12HR TF.
I need Monday's Pre-NYSE data to give a more detailed analysis on smaller TF.
The BEAR signal arrived, and what a monster it is!
Keynote:
Fundamentally something was very off, specifically regarding stocks.
Even though - yes, tariff uncertainty, massively overbought technically.
It had the aroma of serious insider trading profit taking pre-NFP!
I can't help but feel it was a massive exactly timed profit grab
Stocks hardly moved on the event itself...think about it
Also, I believe the labor figures was seriously cooked!!!
I sincerely hope my point of view offers a valued insight
Thank you for taking the time study my analysis.

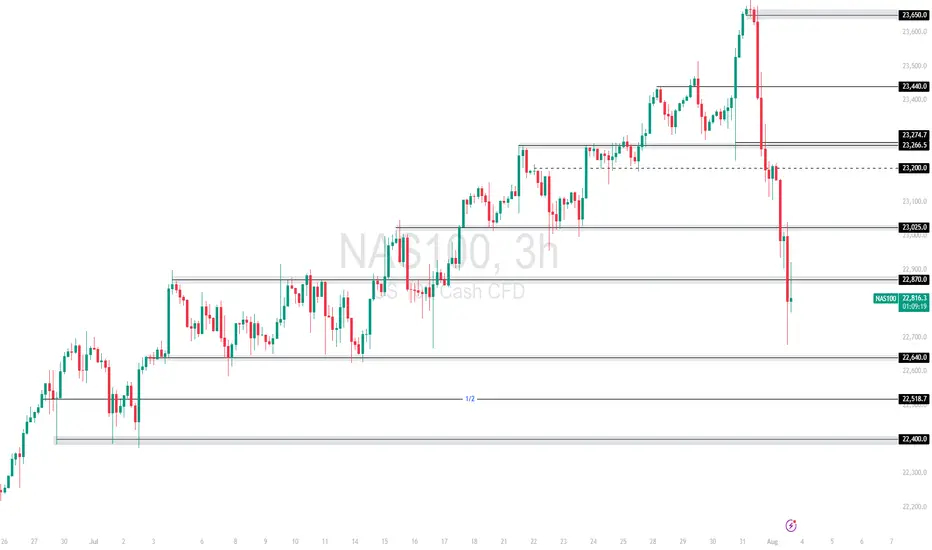
NAS100 – Sharp Breakdown After Tariffs & Jobs Data MissAfter a macro-driven selloff, NAS100 broke decisively below 23,025.0, taking out prior structure and confirming bearish pressure. The drop followed two key catalysts:
📉 Jobs Report Miss: Only 73K jobs added in July vs 200K+ expected — signals a slowing economy.
📛 Tariff Shock: President Trump imposed new tariffs on 90+ countries, up to 41%, rattling global sentiment.
Support at: 22,870.0 🔽 & 22,640.0
Resistance at: 23,025.0 🔼 & 23,200.0
🔎 Bias:
🔼 Bullish: Sustained strength above 22,870 with momentum could aim for 23,025 retest.
🔽 Bearish: Rejection below 23,025 or break under 22,870 opens space to 22,640 and possibly 22,518.
🎯 Let the dust settle – market could still be digesting the shock.
📛 Disclaimer: Not financial advice. Trade responsibly.
NSDQ100 ahead of US Employment data After the US close, Apple and Amazon posted mixed results:
Apple rose ~2% after-hours on a strong revenue beat ($94bn vs $89.3bn est.) and broad-based growth, especially in China — its first sales increase there in two years.
Amazon fell after projecting weaker Q3 operating profits ($15.5–$20.5bn vs $19.4bn est.) and showing slower cloud growth than competitors, raising concerns over its AI strategy.
These results pulled NASDAQ 100 futures down by -0.20%, as investors digested disappointing Amazon guidance despite Apple’s strength.
Additional Drivers:
US July Jobs Report due today may add volatility. Slower payroll growth (+75k est.) and a rise in the unemployment rate (to 4.2%) could support a dovish Fed narrative.
Trump’s Global Tariff Announcement added macro uncertainty, with sharp tariff hikes on countries with trade surpluses, including a 35% hit to Canada and 39% to Switzerland. This weighs on global trade sentiment.
Pharma Pressure: Trump is also targeting drugmakers on pricing. AstraZeneca hinted at unsustainability, suggesting regulatory risk may be rising for the sector.
Conclusion for NASDAQ 100 Trading:
The tech-heavy NASDAQ 100 faces near-term downside pressure, driven by Amazon’s weak outlook, broader macro headwinds from tariffs, and potential labor market softness. However, Apple's strong China rebound and stabilizing consumer trends (e.g., Target) offer some support. Expect choppy trade as markets await clarity from the jobs report and tariff policy impact.
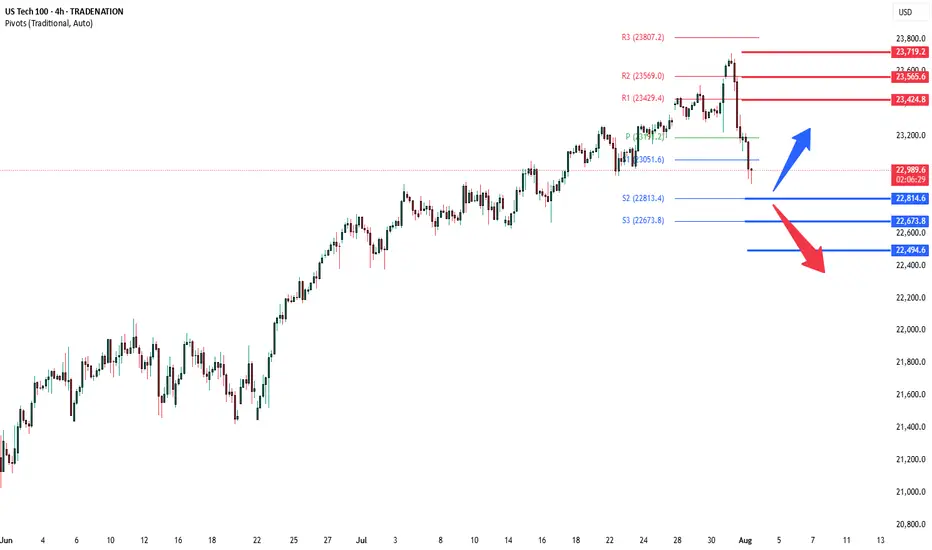
Key Support and Resistance Levels
Resistance Level 1: 23424
Resistance Level 2: 23565
Resistance Level 3: 23720
Support Level 1: 22815
Support Level 2: 22673
Support Level 3: 22500
This communication is for informational purposes only and should not be viewed as any form of recommendation as to a particular course of action or as investment advice. It is not intended as an offer or solicitation for the purchase or sale of any financial instrument or as an official confirmation of any transaction. Opinions, estimates and assumptions expressed herein are made as of the date of this communication and are subject to change without notice. This communication has been prepared based upon information, including market prices, data and other information, believed to be reliable; however, Trade Nation does not warrant its completeness or accuracy. All market prices and market data contained in or attached to this communication are indicative and subject to change without notice.
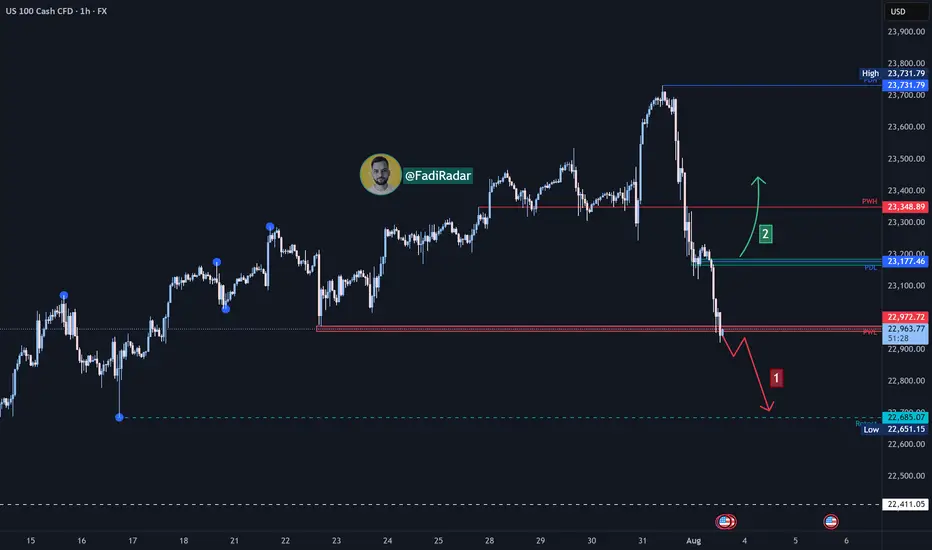
Nasdaq Index Analysis (US100 / NASDAQ):The Nasdaq index experienced a sharp decline yesterday and today, currently testing the 22,950 USD level.
1️⃣ If the price breaks below 22,950 USD and holds, it may lead to further downside toward 22,680 USD as an initial target, followed by 22,400 USD.
2️⃣ On the other hand, if strong buying momentum drives the price above 23,170 USD and holds, we could see a move toward 23,350 USD, and potentially 23,700 USD.
⚠️ Disclaimer:
This analysis is not financial advice. It is recommended to monitor the markets and carefully analyze the data before making any investment decisions.
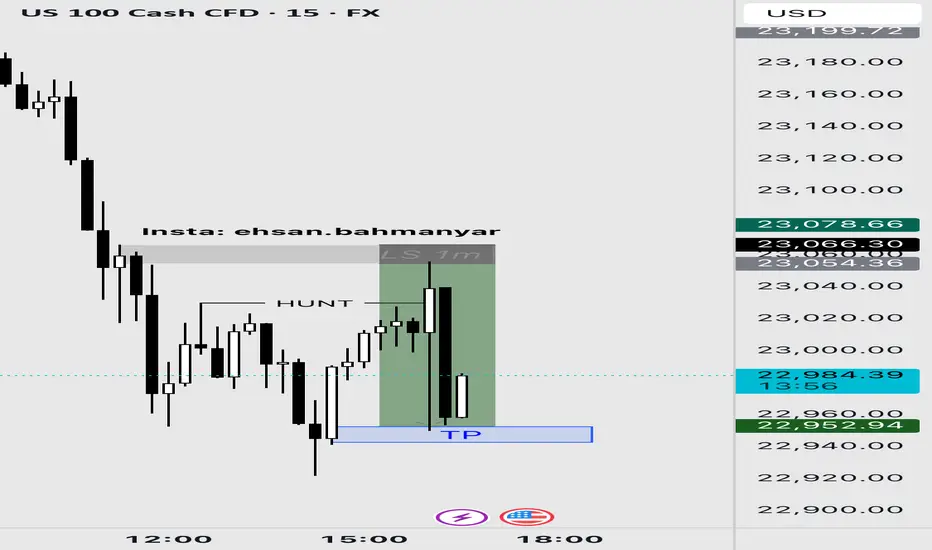
NextGenTraders81: My buy and sell limit ideas for NFPI have set these limits for todays NFP, it might go completely wrong but as im only risking 0.5% on each limit, it should be fun.
Buy limit is at the bottom of the channel, where price is bound to make some reaction, the TP is bellow where i believe it would go up to before continuing the downtrend..
The sell limit is where i believe a LH would be made.
Lets have some fun,
Good luck!
NextGenTraders group

COULD THE NAS100 BREAKOUT THIS IMPORTANT FIB LEVEL?As examined similar to the SPX500, NAS100 has already reached the fib extension target of 0.618 and facing a resistance. There are indicator divergences on the weekly down to the 4H time frames suggestion a potential correction in likely soon. My thesis for this week is that NAS100 could briefly push through the resistance and clear liquidity above the fib resistance with a capitulation candle before a correction. Therefore the trade idea is caution to the upside as there are no major reversal candle yet on higher time frame but indicators are blowing warning horns so apply tight stop loss on the trade plan this week while watching for a reversal confirmation on the 4H or daily charts.

$NDX 3rd Bearish EngulfingSlowly but surely we are seeing deteriorating conditions in every major indices.
NASDAQ:NDX closed and formed the 3rd BEARISH engulfing in 2 weeks, RARE!
Light volume so it's not definitive, but alarming.
TVC:DJI keeps weakening.
SP:SPX many RED candles & bearish engulfing as well.
Light volume though.

Trend Lines AnalysisThe current target is 22143 and after small correction the price will continue towards 24023 target and will proceed further towards 25000 level. If the price fail to break 22143 and price fall sharply from that level then expect it to fall back to 19800 price level where is the yearly pivot point lying.

Nasdaq Index Analysis (US100 / NASDAQ):The Nasdaq index rose following yesterday’s Fed decision and is currently trading near 23,700 USD.
1️⃣ The most likely scenario is a pullback to retest the 23,570 USD zone, or even 23,500 USD, before resuming its upward movement toward a new high.
2️⃣ However, if the price breaks below 23,500 USD and holds, it could trigger a decline toward 23,350 USD, followed by 23,200 USD.
⚠️ Disclaimer:
This analysis is not financial advice. It is recommended to monitor the markets and carefully analyze the data before making any investment decisions.

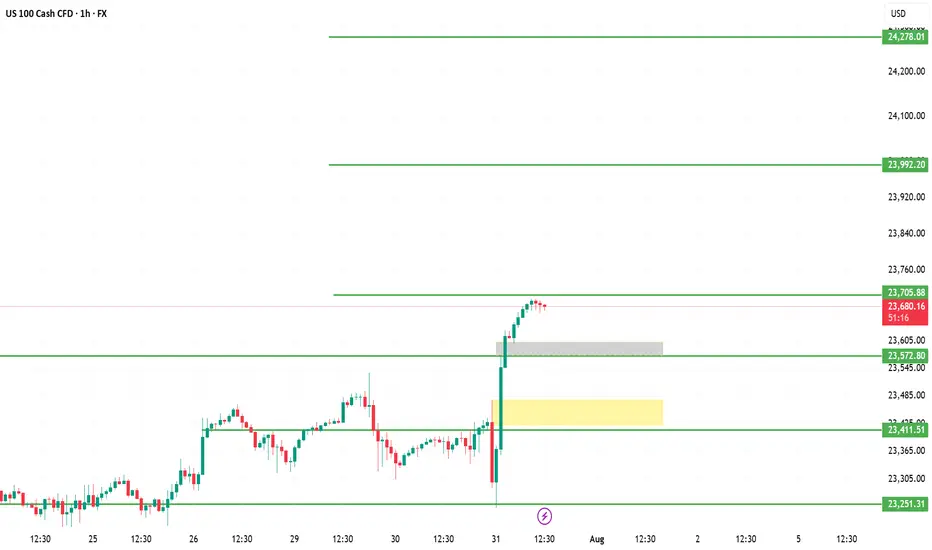
US100 (NASDAQ) Analysis – 1H Chart | July 31, 20251. Vertical Bullish Rally
Price exploded upward from 23,251 to 23,705 with strong bullish momentum and no meaningful retracement, indicating a short-term overbought scenario.
2. Fresh Supply at 23,705
The current candle shows hesitation just below 23,705.88 — forming a possible short-term top or reaction zone where sellers might step in.
3. Imbalance Zone Below
A visible Fair Value Gap (FVG) is left between 23,572–23,600 and the yellow highlighted demand zone (23,411) is untested. Price may revisit to fill that imbalance.
4. Projection: Pullback Possible
If price fails to break and hold above 23,705, we may see a pullback toward 23,600 → 23,411 before the next move.
5. Key Levels
Resistance: 23,705 → 23,992 → 24,278
Support: 23,572 → 23,411 → 23,251
Structure remains bullish unless 23,411 breaks.
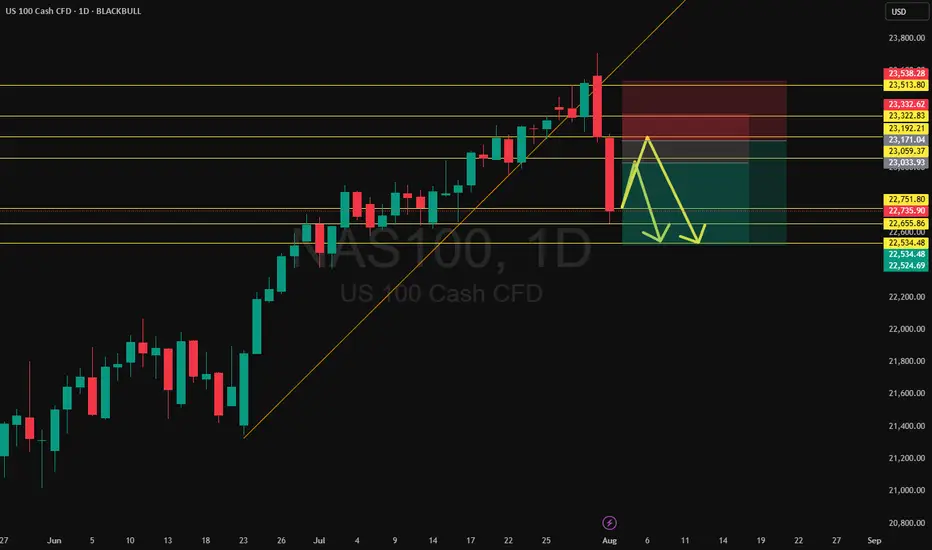
Nasdaq Short: Catching a rising knife. Stop loss at 23500.Hi everyone, here I am trying to catch the peak of Nasdaq again. As mentioned, the previous idea was stopped out at 23,320. Now, for this idea, I am attempting another short with a 30 points risk for Nasdaq. The stop for this idea is fixed at 23,500. The take profit is 22,650.
This is a positional trade and I will re-evaluate as the waves unfolds. So the strategy will mainly be trailing the stop periodically.
Thank you and good luck!

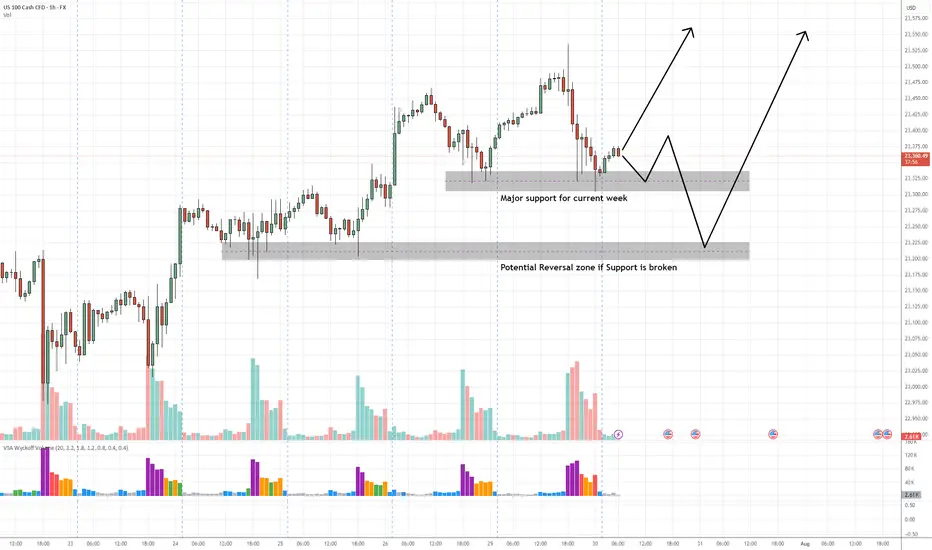
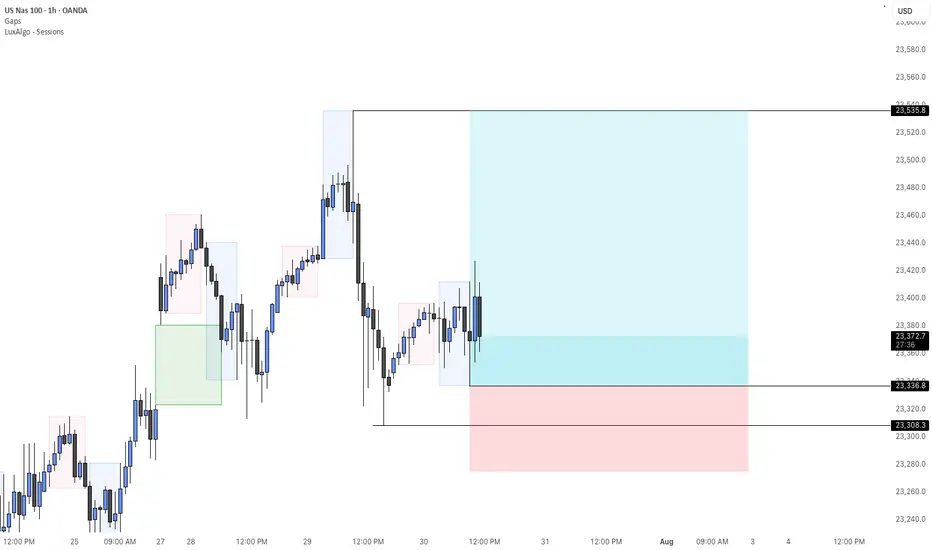
NAS100 Buy Setup – VSA & Multi-Zone Demand Analysis✅ Primary Entry Zone: Major support for current week (around 23,325–23,350)
✅ Secondary Entry Zone: Potential reversal zone if primary support is broken (around 23,200–23,230)
🎯 Target 1 (TP1): Previous swing high near 23,500
🎯 Target 2 (TP2): Extension above 23,550
🛑 Stop Loss (SL): Below 23,170 (beyond secondary reversal zone to avoid false breaks)
📊 Technical Insight (VSA & Price Action Structure)
Support Structure:
The current major support zone has been tested multiple times with no follow-through selling, indicating strong buying interest from larger players.
Volume Spread Analysis Observations:
On the recent decline into the major support zone, we see wider spreads on high volume followed by narrow range candles on lower volume, a classic sign of stopping volume and supply exhaustion.
Within the secondary reversal zone, historical reactions show climactic volume spikes leading to sharp reversals, suggesting this level is watched closely by smart money.
Any test back into the zone on low volume would confirm the No Supply (NS) condition.
Trade Pathways:
Scenario 1: Price respects the major support and begins to climb, confirming demand dominance → target TP1 then TP2.
Scenario 2: Support is temporarily breached, triggering a liquidity grab into the secondary reversal zone, followed by a bullish reversal bar on high volume → strong buy signal with potentially faster move toward TP levels.
📍 Bias: Bullish as long as price holds above the secondary reversal zone.
📌 Execution Tip: Wait for a wide spread up-bar on increased volume from either zone to confirm the start of the markup phase.
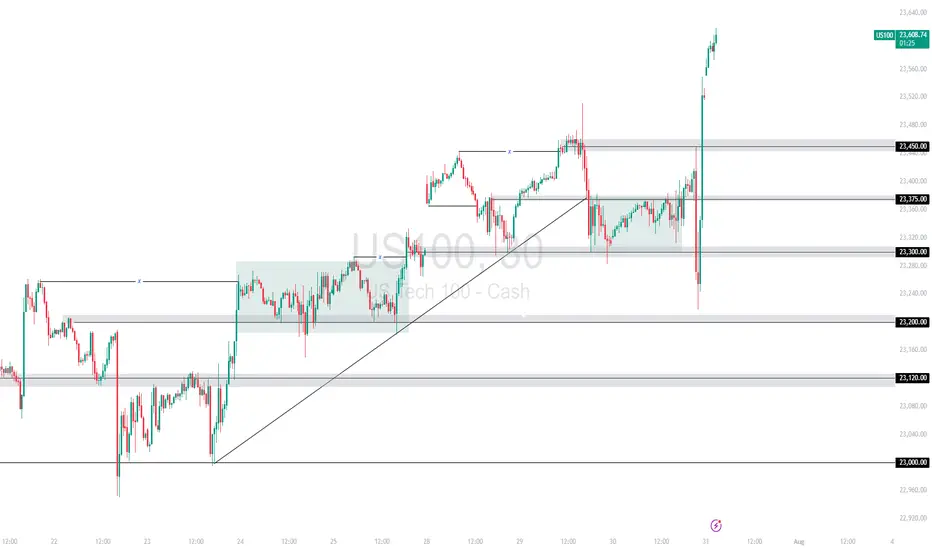
US100 Surges on Strong Fed Data and Trump Trade Deals A combination of upbeat economic data from the Fed and renewed optimism from Trump’s trade announcements fueled a powerful bullish rally on the US100. Price broke above the 23,450 🔼 resistance after reclaiming the 23,300 🔽 zone, leaving behind a strong V-shaped recovery from 23,200 🔽.
Support Levels: 23,450 🔽, 23,375 🔽, 23,300 🔽
Resistance Levels: None locally – price is printing new highs
Bias:
🔼 Bullish: Holding above 23,450 could support further upside. A clean retest may offer continuation entries.
🔽 Bearish: A drop back below 23,450 would weaken the rally and may open the path to 23,375 or 23,300.
📛 Disclaimer: This is not financial advice. Trade at your own risk.
NAS - LONGWaiting to see how news affects the markets today. IF we hold this area and we get confirmation that buyers are taking over. I will enter long and target previous highs.
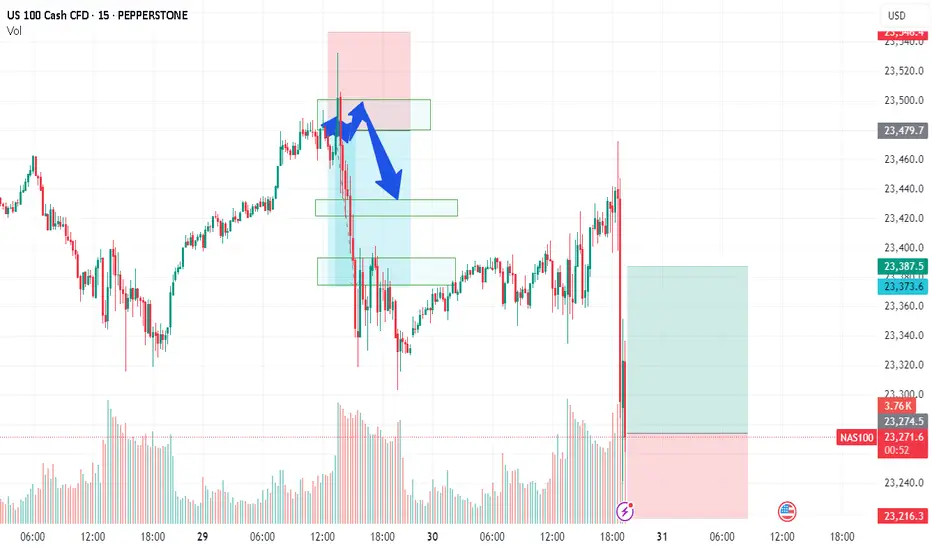
NAS100 - EXPECTING THE DUMPTeam, we got short well today with AUS200 - both target hit
we have set up the NAS entry , this is the entry price 23268 - 23200
STOP LOSS at 23100
Once it break above 23320 - bring stop loss to BE
Target 1 at 23320-60 - take 50%-70& partial
Target 2 at 23380-23400
LETS GO
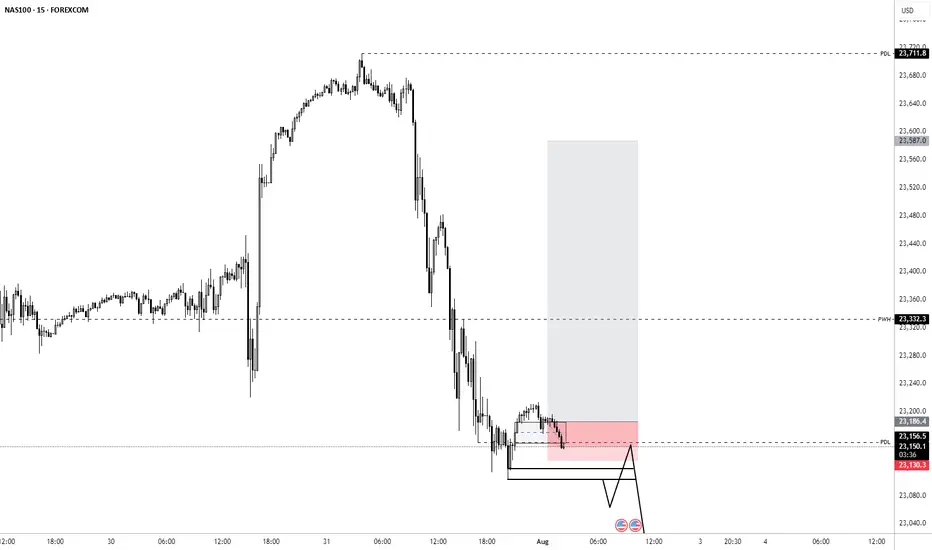
US100/NQ short idea PM session I expect yesterdays high to hold. For NQ reaching a discount, a 400 point move can happen. WATCH A 5m FVG formation for entry
