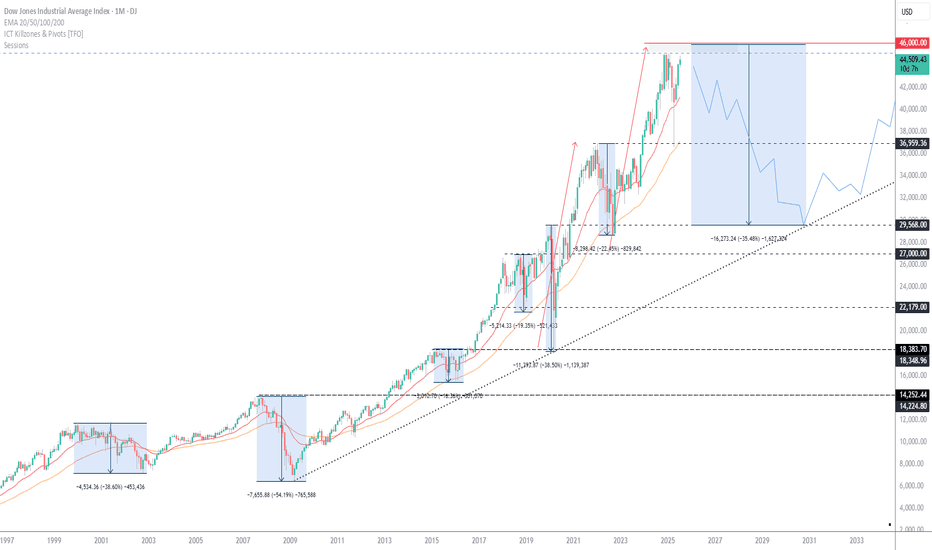
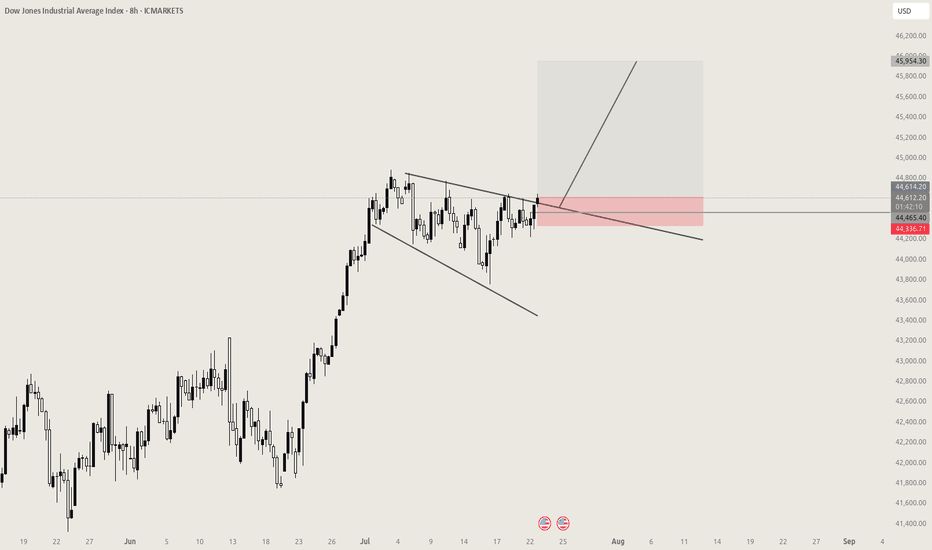
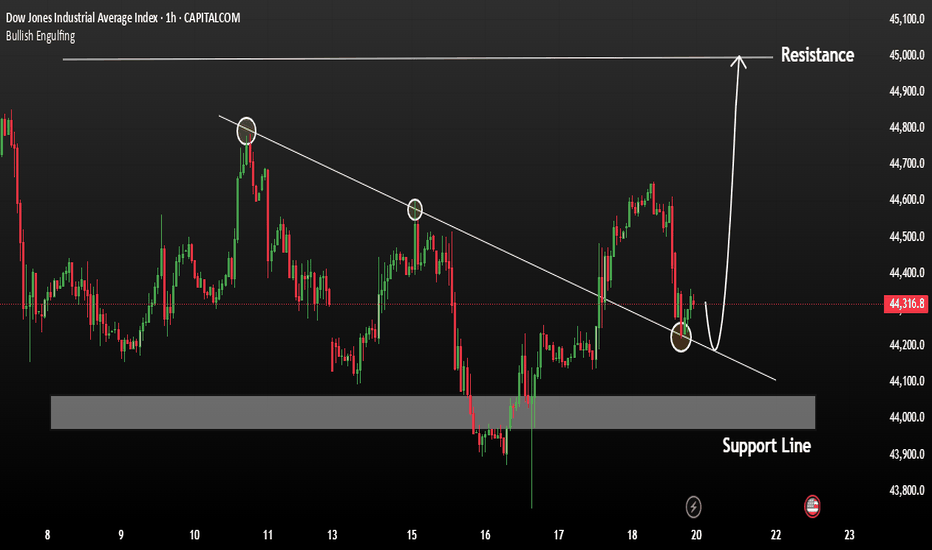
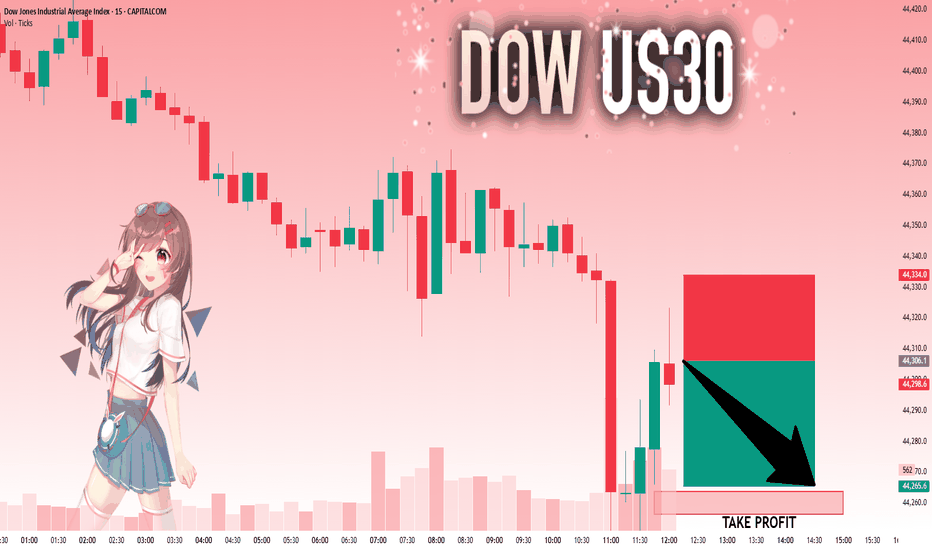
Dow jones - Head & Shoulder formation - Towards 36,500Dow Jones has Head & Shoulder breakdown, With this it will have following targets possible, 37700 - 37200 - 36500Shortby NileshPrajapati852
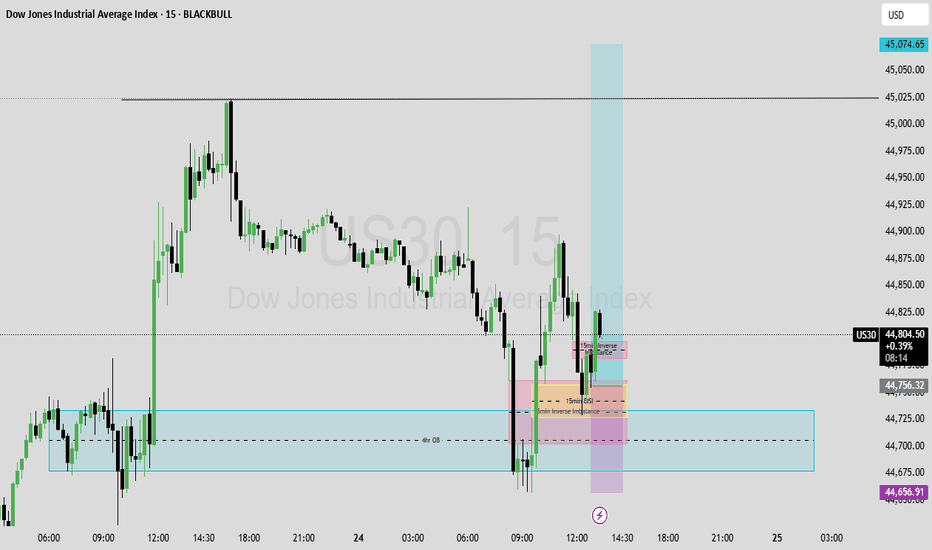
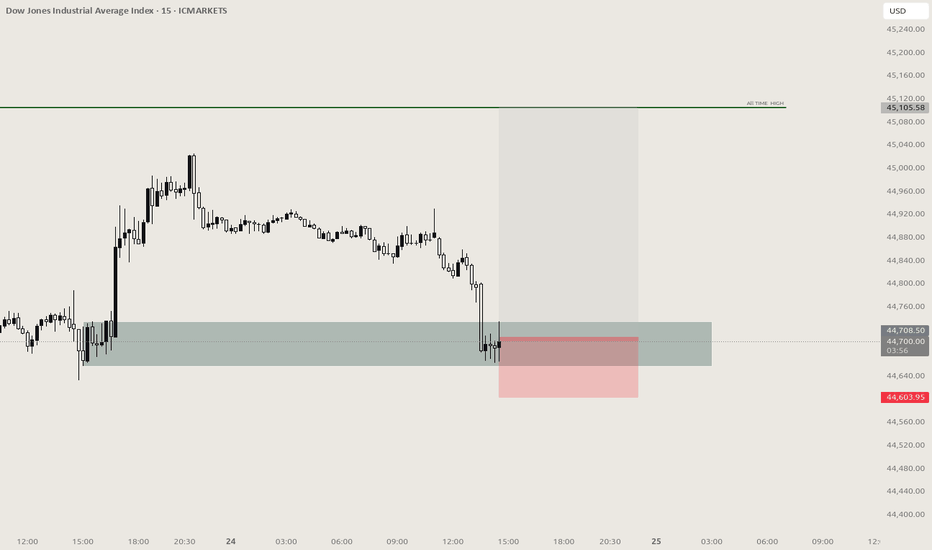
us30 Currently in a down trend but opened the day with a GAP down. near a 30min bullish OBLongby bodyrocc112
Dow Jones INTRADAY bearish below 42375Key Support and Resistance Levels Resistance Level 1: 42375 Resistance Level 2: 42846 Resistance Level 3: 43288 Support Level 1: 40560 Support Level 2: 40000 Support Level 3: 39637 This communication is for informational purposes only and should not be viewed as any form of recommendation as to a particular course of action or as investment advice. It is not intended as an offer or solicitation for the purchase or sale of any financial instrument or as an official confirmation of any transaction. Opinions, estimates and assumptions expressed herein are made as of the date of this communication and are subject to change without notice. This communication has been prepared based upon information, including market prices, data and other information, believed to be reliable; however, Trade Nation does not warrant its completeness or accuracy. All market prices and market data contained in or attached to this communication are indicative and subject to change without notice. by TradeNation1
US30 BUY CorrectionsPotential for a bullish pullback on the US30 1D which could lead to a price movement towards the resistance level at 40600. BUY levels from 37800Longby GOLDFXCC1
DOW JONES INDEX (US30): Detailed Support & Resistance Analysis Here is my latest structure analysis for US30 Index. Resistance 1: 40650 - 40850 area Resistance 2: 41150 - 41300 area Resistance 3: 42550 - 42850 area Support 1: 40000 - 40250 area Support 2: 39470 - 39650 area Support 3: 38400 - 38650 area Consider these structures for pullback/breakout trading. ❤️Please, support my work with like, thank you!❤️ I am part of Trade Nation's Influencer program and receive a monthly fee for using their TradingView charts in my analysis.Shortby VasilyTrader114
Do Or Die!The past few weeks have caught out many bulls as Trump tariffs wreck the markets. 41K support today may just be the bottom, this area must hold, otherwise we are heading not just for a correction but a bear market. The falls have been consistent and steady, no real plunges which points to a correction, although we do have a double top from the Dec highs and early Feb highs. Gold and silver have been the standout performers, 3000 gold will be blown away. A mix of Trump threats of tariffs and many beginning to wake up to media attention in PM's....a hedge against turmoil. Any close below the Dow low is a short, from here bottom fishing just may produce a rally of significance, perhaps a rally to sell. Appreciate a thumbs up and God Bless you all!Longby Fractal777Updated 12
Bullish ideaUS30 may rise if it remains above 36,000 as it is a halfway mark of the previous bull run. As long as price is above 36,400 and 37,000, the indice may try to reach 39,000 and 40,500. Price action is oscillating between 42,500 and 36,400.Longby Two4One41
Intraday entry 1Everything is pretty much explained in the picture itself. I am Abhishek Srivastava | SEBI-Certified Research and Equity Derivative Analyst from Delhi with 4+ years of experience. I focus on simplifying equity markets through technical analysis. On Trading View, I share easy-to-understand insights to help traders and investors make better decisions. Kindly check my older shared stock results on my profile to make a firm decision to invest in this. Kindly dm for further assistance it is for free just for this stock. Thank you and invest wisely. Longby Abhishekingx1
DJIDOW Jones - Fibonacci Level - 50.00% - Demand Zone - Break of Structure - Completed " 12345 " Impulsive Waves - Order Blockby ForexDetective2
US30 Index Have seen full bearish move at closing now expecting a minor retracement before continuation Longby AsiaforexcvUpdated 2
US30: Absolute Price Collapse Ahead! Short! My dear friends, Today we will analyse US30 together☺️ The in-trend continuation seems likely as the current long-term trend appears to be strong, and price is holding below a key level of 37,395.0 So a bearish continuation seems plausible, targeting the next low. We should enter on confirmation, and place a stop-loss beyond the recent swing level. ❤️Sending you lots of Love and Hugs❤️ Shortby FreeXauusdSignals113
No Signs of the Bull ArmyDow Jones Update : The correction appears likely to continue, testing the 40,045–40,467 range. Subsequently, the index is expected to rebound toward the 40,714–40,945. Additionally, it is worth noting the gap in the 41,173–41,629 range—perhaps the market may find its way there.by herdityawicaksana1
us30 early morning predictioncan see Us30 hitting yesterday's high and then fall back for a retest. If follow this trade do before trump's big announcement on tariff's.by wavybans13
NOT TAGGED US30This setup was seen because of the resting highs spotted on the discussion dropped before this one, and the 15 m gap left as the market rose within the mids, I am not yet tagged but I am not on the rush to being tagged because the plan is a gap, zone, breaker block, premium price, and they all tick, if it does not, well well well, this will be just another day, no rush. Happy Tradingby TheDemoTrader_SA2
US30 Trade Update – 03/04/2025 🚨 US30 Trade Update – 03/04/2025 🚨 📉 Massive Rejection & Sell-Off! US30 has broken below 41,300 and is now testing key support at 41,184. Bears are in control, and a further drop to 40,678 is on the table if this level breaks. 🔍 Key Observations: ✅ Breakdown from 42,359 Resistance ✅ Failed to Hold Above 41,749 Support 🔻 Next Major Support: 40,678 🎯 Trade Plan: 🔹 Short below 41,184 → Target 40,678 🔹 Long only if price reclaims 41,550+ ⚠️ Watch for a reaction at 41,184 before confirming direction.by h4rVey1
Dow Jones Industrial Average (DJI) - Technical Analysis🧠 Dow Jones Industrial Average (DJI) - Technical Analysis 📅 Chart Date: April 2, 2025 🔍 Pattern Observations Previous Uptrend (Left Section of Chart): The chart shows a classic Head and Shoulders (H&S) pattern that formed after a strong uptrend. Left Shoulder, Head, and Right Shoulder were clearly formed and confirmed. The price reversed strongly after completing this H&S, indicating a bearish reversal. Current Pattern Forming (Right Section of Chart): A new H&S pattern is now forming, suggesting another potential bearish setup. The Left Shoulder and Head are already in place. The price is currently moving upward toward what may become the Right Shoulder. Expected completion of Right Shoulder around the 40,000 level. A trendline support from the prior lows aligns with this area, strengthening this level as a possible resistance zone. 📉 Bearish Breakdown Scenario (Pattern Confirmation) If price reaches ~40,000, forms the Right Shoulder, and then starts to decline, the pattern will be complete. A decisive breakdown below the neckline (drawn from the lows of Left Shoulder and Right Shoulder base) would confirm the bearish H&S pattern. In that case, projected target zone would be calculated as: Target=Neckline−(Head−Neckline) Target=Neckline−(Head−Neckline) Depending on exact neckline placement, target could be around 38,000 or lower. 🚫 Invalidation Scenario (Pattern Failure) If price breaks above the Head region (~42,500 - 42,800), then the current H&S pattern gets nullified. In this case, the structure becomes bullish again, potentially leading to new highs beyond 43,000+. 📌 Key Levels to Watch Level Significance 42,500-42,800 Head Resistance / Pattern Invalidation 40,000 Expected Right Shoulder Peak 38,000 H&S Breakdown Target 41,000 Interim Support 39,500 Neckline (approx.) ⚠️ Risk Factors H&S is a reliable reversal pattern, but like all technical patterns, confirmation is key. Right Shoulder is still under formation; premature trading before confirmation could lead to false signals. Market sentiment, macroeconomic news (like inflation data, Fed announcements), or geopolitical events could override technical patterns. ✅ Conclusion DJI has already completed one H&S pattern post-uptrend and saw a bearish reversal. Now, it's potentially forming another H&S, and 40,000 is a key level for the Right Shoulder. If the price rejects at 40,000 and breaks below neckline, bearish trend may resume, targeting 38,000 or lower. If the price breaks above the Head (~42,800), the bearish structure is invalid, and we may see a bullish continuation. 📢 Disclaimer This analysis is for educational and informational purposes only and does not constitute investment advice. Trading involves substantial risk and is not suitable for every investor. Please consult your financial advisor before making any investment decisions. The chart patterns discussed are based on historical price action and do not guarantee future performance. Shortby shiva5600603
DJIA H4 | Potential bullish bounceDJIA (US30) is falling towards a multi-swing-low support and could potentially bounce off this level to climb higher. Buy entry is at 41,282.01 which is a multi-swing-low support that aligns close to the 78.6% Fibonacci retracement. Stop loss is at 41,080.00 which is a level that lies underneath a multi-swing-low support and the 78.6% Fibonacci retracement. Take profit is at 42,240.15 which is an overlap resistance that aligns with the 61.8% Fibonacci retracement. High Risk Investment Warning Trading Forex/CFDs on margin carries a high level of risk and may not be suitable for all investors. Leverage can work against you. Stratos Markets Limited (www.fxcm.com): CFDs are complex instruments and come with a high risk of losing money rapidly due to leverage. 63% of retail investor accounts lose money when trading CFDs with this provider. You should consider whether you understand how CFDs work and whether you can afford to take the high risk of losing your money. Stratos Europe Ltd (www.fxcm.com): CFDs are complex instruments and come with a high risk of losing money rapidly due to leverage. 63% of retail investor accounts lose money when trading CFDs with this provider. You should consider whether you understand how CFDs work and whether you can afford to take the high risk of losing your money. Stratos Trading Pty. Limited (www.fxcm.com): Trading FX/CFDs carries significant risks. FXCM AU (AFSL 309763), please read the Financial Services Guide, Product Disclosure Statement, Target Market Determination and Terms of Business at www.fxcm.com Stratos Global LLC (www.fxcm.com): Losses can exceed deposits. Please be advised that the information presented on TradingView is provided to FXCM (‘Company’, ‘we’) by a third-party provider (‘TFA Global Pte Ltd’). Please be reminded that you are solely responsible for the trading decisions on your account. There is a very high degree of risk involved in trading. Any information and/or content is intended entirely for research, educational and informational purposes only and does not constitute investment or consultation advice or investment strategy. The information is not tailored to the investment needs of any specific person and therefore does not involve a consideration of any of the investment objectives, financial situation or needs of any viewer that may receive it. Kindly also note that past performance is not a reliable indicator of future results. Actual results may differ materially from those anticipated in forward-looking or past performance statements. We assume no liability as to the accuracy or completeness of any of the information and/or content provided herein and the Company cannot be held responsible for any omission, mistake nor for any loss or damage including without limitation to any loss of profit which may arise from reliance on any information supplied by TFA Global Pte Ltd. The speaker(s) is neither an employee, agent nor representative of FXCM and is therefore acting independently. The opinions given are their own, constitute general market commentary, and do not constitute the opinion or advice of FXCM or any form of personal or investment advice. FXCM neither endorses nor guarantees offerings of third-party speakers, nor is FXCM responsible for the content, veracity or opinions of third-party speakers, presenters or participants.Long03:05by FXCM4
US30 SELL NOW!!!!!!!US30 made a strong price rejections off the supply zone am looking forward to see price take out the sell side liquidity from this point and create new lows 41,189 is my goal targetShortby CAPTAINFX23
US30 BEARISH AGAINhi there, how's going on? My last analysis didn't go well. This is my new analysis. I'm still on the same decline as before. What you think about it? is it go well or not?Shortby AlexRider10113
Moustafa! My analysis and view for US 30! on 16.03.2025!- I expected a huge bearish wave would hit the index by end of December and also in January and I sat an idea for it and it was right and that is the new idea - On the weekly frame, you would notice that the index is in a rising channel - Formed a double top pattern and even broke the neckline of it and is supposed to go to minimum the Take profit 2 then after the retrace towards the take profit 3 - The index retraced to the upside due to the uptrend line in green and there is a possibility that it could continue the bullish run but I do not expect here that a weekly candle would close above the neckline before reaching to the below TPs - The lower weekly candles wicks from 15.04.2024 and 05.08.2024 must be filled anyway, which is giving another confirmation to the validation of this idea concept and the continuation of the bearish wave on the weekly chart! we could see on the way some retracements on the daily frame and the lower frames, but that will not have any influence on the bigger bearish image! - The index had broken already the uptrend line (in red) which was not broken from October 2023! and the last week candle closed under the moving average 50! - By reaching to the TP3, means that the index would go to the lower line of the rising channel -- Conclusion is that we are in a bearish market on the weekly chart and the real target is exactly when the index will reach to the line (in yellow) I sat also another idea for Nasdaq which I see also there the continuation of the big bearish wave on the weekly chart! so feel free to have a look on too! so all is going in harmony together! Shortby moustafa_mareiUpdated 3313
US30 3D IdeaPotential for a bearish pullback on the US30 3D which could lead to a price movement towards the support level at 38400. SELL levels from 41900Shortby GOLDFXCCUpdated 3