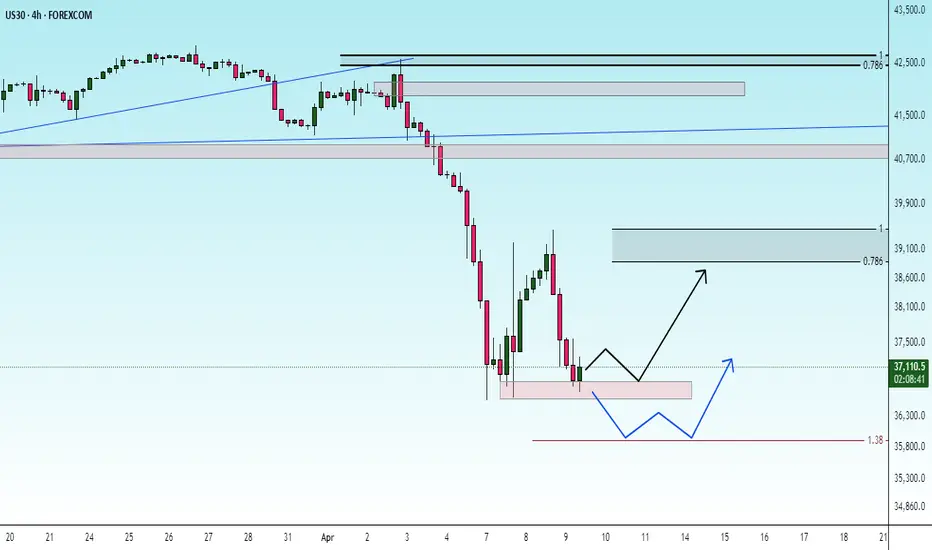
US30 — Support Holding or Further Drop? Key Levels To WatchUS30 (Dow Jones) — 4H Chart
Price is currently hovering around a key support zone near 37,000 after a strong bearish impulse.
Scenarios I'm Watching:
▸ Bullish Scenario:
If the support zone holds and price reclaims 37,500 — I would look for price to retest the 38,300-38,800 zone.
A clean break and hold above 39,500 could open doors towards the 40,000-41,000 resistance area.
▸ Bearish Scenario:
If price fails to hold this support, and breaks below 36,850 — I expect further downside towards the next key supports:
35,800
34,500
33,000
Trading Plan:
Waiting for clear price action confirmation at this support zone.
Will avoid trading in the middle of the range — prefer breakout or retest setups.
Levels marked on chart for clarity.
If you found this analysis valuable, kindly consider boosting and following for more updates.
Disclaimer: This content is intended for educational purposes only and does not constitute financial advice.
US30 trade ideas

Long US30 chart CMCMARKETS:US30 NDS style analysis : Based on this NDS-style analysis from DR fuzzy logic, we expect that for the completion of our king pattern, from this point f2 after hitting ND, our chart will temporarily become Saudi to hit point 2, then we will fall again to below F3 to create the F3 peak.

DOW 104% TARIFFS on China activated. Can the market be saved?Dow Jones (DJIA) is almost on its 1W MA200 (orange trend-line) and earlier today President Trump activated 104% duties on Chinese imports. This is far from being an encouraging development especially after Monday's attempt for the market to recover.
Most of the gains were lost yesterday and today it is a wait-and-see game in anticipation of the market reaction on the opening bell of Wall Street.
From a long-term technical perspective however, Dow is on a huge buy level that we've only seen another 4 times since the Housing Bubble bottom in March 2009. That buy level consists of two conditions: price touching the 1W MA200 and the 1W RSI hits (or comes extremely close to) the 30.00 oversold limit.
As you can see that has happened last time on September 19 2022 (Inflation Crisis bottom), March 09 2020 (COVID crash), August 24 2015 (China slowdown, Grexit) and August 08 2011 (first correction since 2009 Housing Crisis). The situation most similar to the current, is the COVID crash as it was the fastest drop to the 1W MA200 and 1W RSI to 30.00.
Despite the brutal correction, it took the market 'only' 43 weeks (301 days) to reach again the 0.786 Fibonacci retracement level. That is the top of the Blue Zone of the Fibonacci Channel Up that started on the March 2009 Housing bottom. The Blue Zone, consisting of the 0.786 - 0.382 Fib range, is important as it has dominated the multi-year bullish trend and contained the price action inside it, with only a few occasions diverging outside of it.
The longest it took Dow to reach the 0.786 Fib again after such correction was 110 weeks (770 days) and that interestingly enough happened two out of the four times. Practically reaching the 0.786 Fib constitutes a Cycle Top.
So essentially, despite the uncertainty and panic, the market is technically on a Support level that in 16 years we've only seen another 4 times, that's once every 4 years, which is a fair sample of a Cycle size. As a result, assuming stability comes to the world through trade deals (and why not Rate Cut announcements), we may see Dow reaching its 0.786 Fib again (and make new ATH) the fastest by February 02 2026, hitting 49000 and the longest by May 17 2027, hitting 56000 roughly.
-------------------------------------------------------------------------------
** Please LIKE 👍, FOLLOW ✅, SHARE 🙌 and COMMENT ✍ if you enjoy this idea! Also share your ideas and charts in the comments section below! This is best way to keep it relevant, support us, keep the content here free and allow the idea to reach as many people as possible. **
-------------------------------------------------------------------------------
💸💸💸💸💸💸
👇 👇 👇 👇 👇 👇

uptrend Considering the behavior of the index in the current support range, possible scenarios have been identified. An upward trend is expected to form and progress to the specified resistance range.
DOW: 37645 | the Top is in a necessary RESETGATT and WTO was favorable to competitive nations
goods and services make up the economy of countries
and with the rise of demand on both
TRUMP is looking at the LONG GAME

US30 I Bullish Bounce Based on the D1 chart analysis, the price is approaching our buy entry level at 36,516.88, a pullback support.
Our take profit is set at 40,052.43, a pullback resistance.
The stop loss is placed at 34,049.36, an overlap support.
High Risk Investment Warning
Trading Forex/CFDs on margin carries a high level of risk and may not be suitable for all investors. Leverage can work against you.
Stratos Markets Limited (tradu.com):
CFDs are complex instruments and come with a high risk of losing money rapidly due to leverage. 63% of retail investor accounts lose money when trading CFDs with this provider. You should consider whether you understand how CFDs work and whether you can afford to take the high risk of losing your money.
Stratos Europe Ltd (tradu.com):
CFDs are complex instruments and come with a high risk of losing money rapidly due to leverage. 63% of retail investor accounts lose money when trading CFDs with this provider. You should consider whether you understand how CFDs work and whether you can afford to take the high risk of losing your money.
Stratos Global LLC (tradu.com):
Losses can exceed deposits.
Please be advised that the information presented on TradingView is provided to Tradu (‘Company’, ‘we’) by a third-party provider (‘TFA Global Pte Ltd’). Please be reminded that you are solely responsible for the trading decisions on your account. There is a very high degree of risk involved in trading. Any information and/or content is intended entirely for research, educational and informational purposes only and does not constitute investment or consultation advice or investment strategy. The information is not tailored to the investment needs of any specific person and therefore does not involve a consideration of any of the investment objectives, financial situation or needs of any viewer that may receive it. Kindly also note that past performance is not a reliable indicator of future results. Actual results may differ materially from those anticipated in forward-looking or past performance statements. We assume no liability as to the accuracy or completeness of any of the information and/or content provided herein and the Company cannot be held responsible for any omission, mistake nor for any loss or damage including without limitation to any loss of profit which may arise from reliance on any information supplied by TFA Global Pte Ltd.
The speaker(s) is neither an employee, agent nor representative of Tradu and is therefore acting independently. The opinions given are their own, constitute general market commentary, and do not constitute the opinion or advice of Tradu or any form of personal or investment advice. Tradu neither endorses nor guarantees offerings of third-party speakers, nor is Tradu responsible for the content, veracity or opinions of third-party speakers, presenters or participants.

Trade Idea : US30 Short ( SELL STOP )Technical Analysis Summary:
Daily Chart:
• Trend: Strong bearish breakdown; significant drop below support.
• MACD: Deeply negative, suggesting strong bearish momentum.
• RSI: Oversold at 18.48, indicating exhaustion but not yet reversal.
15-Minute Chart:
• Trend: Clear downtrend continuation.
• MACD: Bearish crossover sustained.
• RSI: Approaching oversold (29.81), but still trending down.
3-Minute Chart:
• Trend: Momentum is slowing down but still bearish.
• MACD: Negative, bearish crossover.
• RSI: Around 33, indicating potential short-term bounce, but no bullish divergence.
⸻
Fundamental Insight:
• The broader US30 index has reacted to strong macroeconomic headwinds (possibly higher-for-longer interest rates, weak earnings, or geopolitical tensions).
• No signs of dovish reversal or major catalyst for a sharp recovery.
⸻
Trade Idea: SHORT POSITION
Entry: 37070 (current price zone—ideal entry on slight retracement)
Stop Loss (SL): 37320 (above minor resistance and recent local high)
Take Profit (TP): 36350 (strong daily support area and psychological level)
Risk-Reward Ratio (RRR):
• Risk: ~270 points
• Reward: ~700 points
FUSIONMARKETS:US30

US30 LongsWe see price rejecting off a15m demand but we expect price to go deeper into the zone, which will give us a rejection off the trendline support. for safe longs we wait for price to cross and close above 37190

Hanzo | US30 15 min Breaks – Will Confirm the Next Move🆚 US30
The Path of Precision – Hanzo’s Market Strike
🔥 Key Levels & Breakout Strategy – 15M TF
🔥 Deep market insight – no random moves, only calculated execution.
☄️ Bearish Setup After Break Out – 38600 Zone
Price must break liquidity with high volume to confirm the move.
🩸 15M Time Frame Confluence
————
CHoCH & Liquidity Grab @ 39610
Key Level / Equal lows Formation - 37750
Strong Rejection from 39280 – The Ultimate Pivot
🔥 1H Time Frame Confirmation
Twin Wicks @ 37700 – Liquidity Engineered
Twin Wicks @ 38300 – Liquidity Engineered
☄️ 4H Historical Market Memory
——
💯 2024 – Bearish Retest 38000
💯 2024 – Bearish Retest 37600
👌 The Market Has Spoken – Are You Ready to Strike?

Falling towards 61.8% Fibonacci support?DJ30 is falling towards the support level which is a pullback support that lines up with the 61.8% Fibonacci retracement and could bounce from this level to our take profit.
Entry: 37,602.11
Why we like it:
There is a pullback support level that lines up with the 61.8% Fibonacci retracement.
Stop loss: 36,538.75
Why we like it:
There is a pullback support level.
Take profit: 39,559.66
Why we like it:
There is a pullback resistance level that lines up with the 50% Fibonacci retracement.
Enjoying your TradingView experience? Review us!
Please be advised that the information presented on TradingView is provided to Vantage (‘Vantage Global Limited’, ‘we’) by a third-party provider (‘Everest Fortune Group’). Please be reminded that you are solely responsible for the trading decisions on your account. There is a very high degree of risk involved in trading. Any information and/or content is intended entirely for research, educational and informational purposes only and does not constitute investment or consultation advice or investment strategy. The information is not tailored to the investment needs of any specific person and therefore does not involve a consideration of any of the investment objectives, financial situation or needs of any viewer that may receive it. Kindly also note that past performance is not a reliable indicator of future results. Actual results may differ materially from those anticipated in forward-looking or past performance statements. We assume no liability as to the accuracy or completeness of any of the information and/or content provided herein and the Company cannot be held responsible for any omission, mistake nor for any loss or damage including without limitation to any loss of profit which may arise from reliance on any information supplied by Everest Fortune Group.

TRADE IDEA: US30 LONG ( BUY LIMIT )
Daily Chart:
• RSI: At 24.33, it’s in oversold territory — potential for a reversal.
• MACD: Strong bearish momentum, but the histogram may be bottoming out, signaling a potential bullish divergence forming.
• Price Action: Testing key support zone near 38300, which was previously a resistance-turned-support area.
15-Minute Chart:
• RSI: At 60.68, indicating early bullish momentum.
• MACD: Bullish crossover recently occurred; histogram rising — confirming short-term upward trend.
• Price Action: Clear bounce from recent lows with higher highs and higher lows forming.
3-Minute Chart:
• Momentum clearly shifting up.
• Price moving above short-term moving average, showing intraday strength.
⸻
Fundamental Context:
• US economic data has recently shown mixed signals, but dovish Fed tone and potential rate cuts in the near future favor equity indices recovery.
• No major bearish macro headlines present at this time to sustain the steep drop.
⸻
Trade Parameters:
• Entry: 38,390 (current price zone, confirming strength above local consolidation)
• Stop Loss (SL): 38,000 (below recent lows and psychological level)
• Take Profit (TP): 39,190 (previous supply zone, daily EMA resistance area)
• Risk: 390 points
• Reward: 800 points
• RRR: 2.05:1
FUSIONMARKETS:US30

Dow Jones INTRADAY oversold bounce back Dow Jones INTRADAY oversold bounce back
Key Support and Resistance Levels
Resistance Level 1: 40617
Resistance Level 2: 42165
Resistance Level 3: 44073
Support Level 1: 37555
Support Level 2: 36620
Support Level 3: 35125
This communication is for informational purposes only and should not be viewed as any form of recommendation as to a particular course of action or as investment advice. It is not intended as an offer or solicitation for the purchase or sale of any financial instrument or as an official confirmation of any transaction. Opinions, estimates and assumptions expressed herein are made as of the date of this communication and are subject to change without notice. This communication has been prepared based upon information, including market prices, data and other information, believed to be reliable; however, Trade Nation does not warrant its completeness or accuracy. All market prices and market data contained in or attached to this communication are indicative and subject to change without notice.

DJI being squeezed into a long term bearish wedgeI know, I sound like a bear monger when the market looks very bullish and at best possible technical support. Nothing wrong with taking advantage of it, but shouldn't forget the bigger picture. The market valuation has been pushed up by easy money since GFC and valuation. The covid money printing made it worse. Bigger the bubble, bigger the burst
With recession around the corner and many hedge funds are facing margin calls, the risks are highest from all metrics, market/GDP, Pe ratios, real income growth, jobs are all slowing down, Debt to GDP has only accelerated. Fringe Economist have been crying wolf since GFC and they are not wrong but when ? This year ?
The market could rally one last leg up to finish in a ending diagonal (if you know wave theory)

US30 Outlook – 08/04/25The Dow Jones (US30) has shown a strong recovery from the recent low at 36,743, bouncing nearly 1,900 points after a steep selloff. Price is now consolidating just under the 38,800 level — a key short-term resistance zone.
🔍 Technical Breakdown:
✅ EMA crossover on the 1H suggests a shift in short-term momentum to the upside
❗️38,800–39,200 is the immediate resistance zone to clear
📉 Macro trend remains bearish unless bulls reclaim 40,000+
🔻 Below 38,000, bears may regain control and retest 37,300 → 36,743
🧭 Bias:
Neutral-Bearish in the macro view
Bullish short-term if price holds above 38,400 and breaks 38,800 cleanly
📌 Levels to Watch:
Support: 38,400 / 37,300 / 36,743
Resistance: 38,800 / 39,200 / 40,000
🧠 Summary:
This bounce looks strong, but it's still a relief rally within a bearish structure. Bulls need a confirmed breakout above 39,200 to flip the narrative. Until then, treat rallies with caution and keep an eye on momentum shifts at resistance.

UPDATE: The Great Depression 2025–2036 for DJIUPDATE: The Great Depression 2025–2036 for DJI
Here is a revised analysis compared to the one from January this year. In that earlier analysis, I was still anticipating a sharp drop to 6,500 points. However, it now seems that the 6,500 level will not be reached. I do expect the DJI to decline to 17,000 points through an ABCDE structure. This structure could potentially take 15 to 20 years to unfold.

Long US30 !!After a long slip the pair manage to find its feet yesterday at 36... It has now pushed to break 38... Could this be a change of trend or just pull back for more bearish movement, I'm riding a bull
