#DJI - 5000 Pts already moved out of 8000 points..Date: 27-06-2025
#DJI - 5000 Pts already moved out of 8000 points as posted on 22nd April. Another 3000 points to cover. we have different pivot for the next level up and it will be shared soon.
Old levels are as follows.
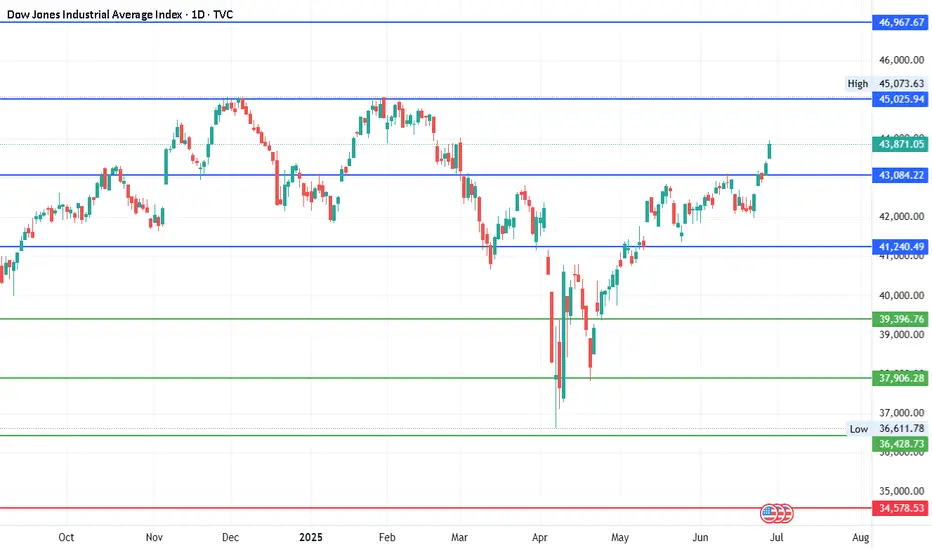
#DJI Upside Targets: 41240.49, 43084.22, 45025.94 and 46967.67
#DJI Downside Targets: 34578.53, 32728.34, 30786.61 and 28844.88
Current price is around 43,870 at the time of this post.
US30 trade ideas
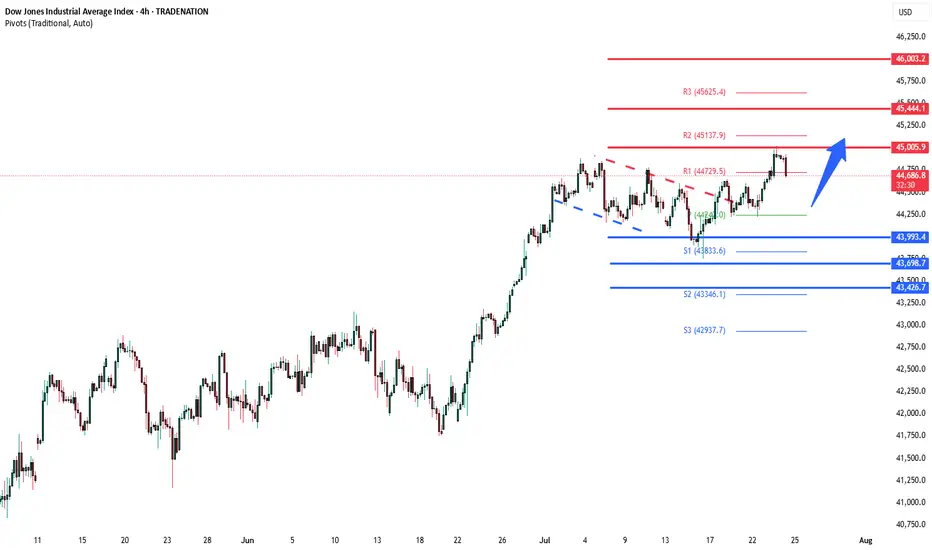
DowJones uptrend support at 43990Key Support and Resistance Levels
Resistance Level 1: 45000
Resistance Level 2: 45444
Resistance Level 3: 46000
Support Level 1: 43990
Support Level 2: 43700
Support Level 3: 43426
This communication is for informational purposes only and should not be viewed as any form of recommendation as to a particular course of action or as investment advice. It is not intended as an offer or solicitation for the purchase or sale of any financial instrument or as an official confirmation of any transaction. Opinions, estimates and assumptions expressed herein are made as of the date of this communication and are subject to change without notice. This communication has been prepared based upon information, including market prices, data and other information, believed to be reliable; however, Trade Nation does not warrant its completeness or accuracy. All market prices and market data contained in or attached to this communication are indicative and subject to change without notice.
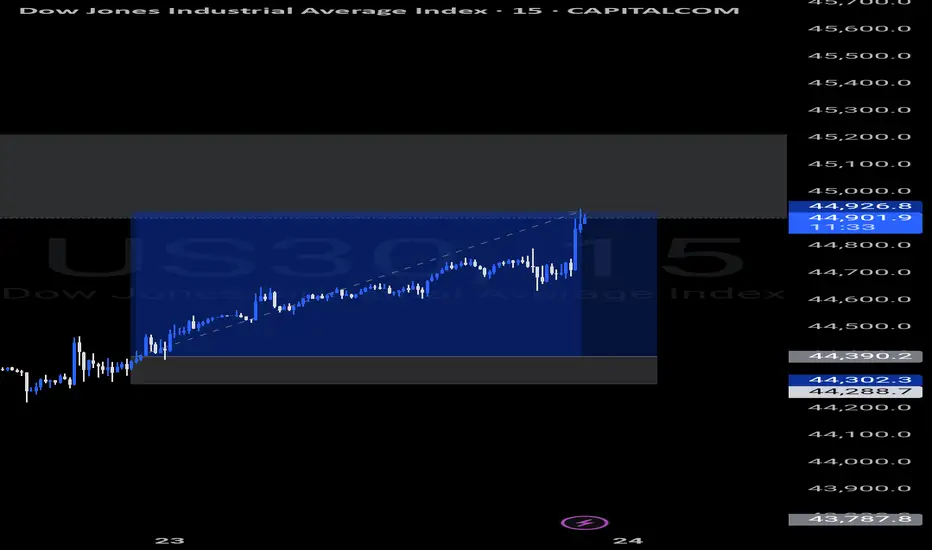
Dow Jones Index Analysis (US30 / Dow Jones):🔹 The index is trading near 44,900 USD and showing short-term bullish momentum, with a potential pullback to retest the 44,700 USD zone.
1️⃣ If strong buying momentum leads to a break and close above 44,960 USD, this could push the price toward the 45,200 USD resistance.
2️⃣ However, if the price breaks below the 44,630 USD support and closes beneath it, we may see a decline toward 44,350 USD.
🔻 A confirmed break below this level could resume the bearish trend and open the path toward 43,900 USD.
⚠️ Disclaimer:
This analysis is not financial advice. Please monitor the markets carefully before making any investment decisions.

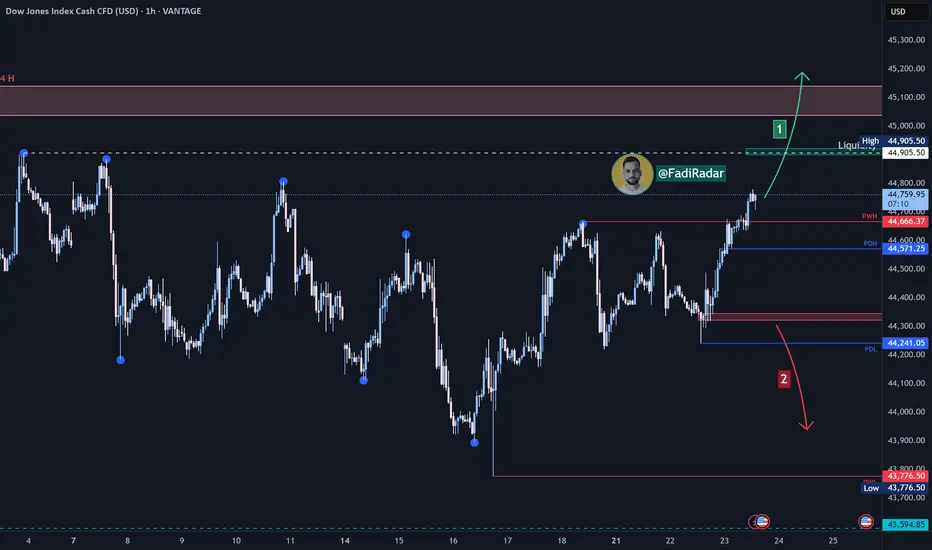
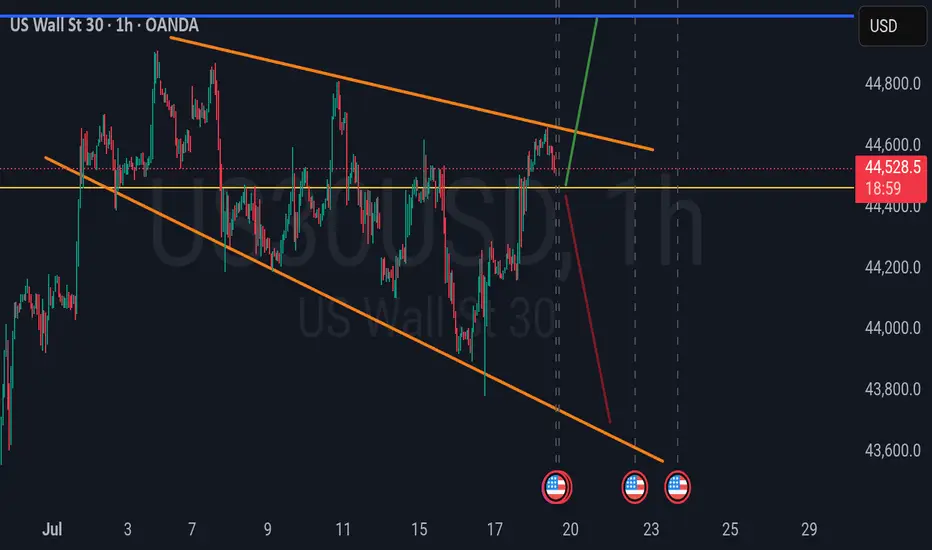
US30 LONG US30 has recently broken out of a multi-session consolidation range and tapped into the 45,000 psychological resistance zone, forming a temporary high around 44,950. With this in mind, I’m seeing two opportunities based on the market structure:
Short-Term Sell Setup
Bias: Counter-trend (retracement)
Entry Zone: 44,850 – 44,950 (rejection at resistance / liquidity grab)
Target Zone:
TP1: 44,400
TP2: 43,950
Stop Loss: Above 45,050
Reason: Price is overextended; likely to pull back before continuing uptrend. This is a scalper/intraday short opportunity.
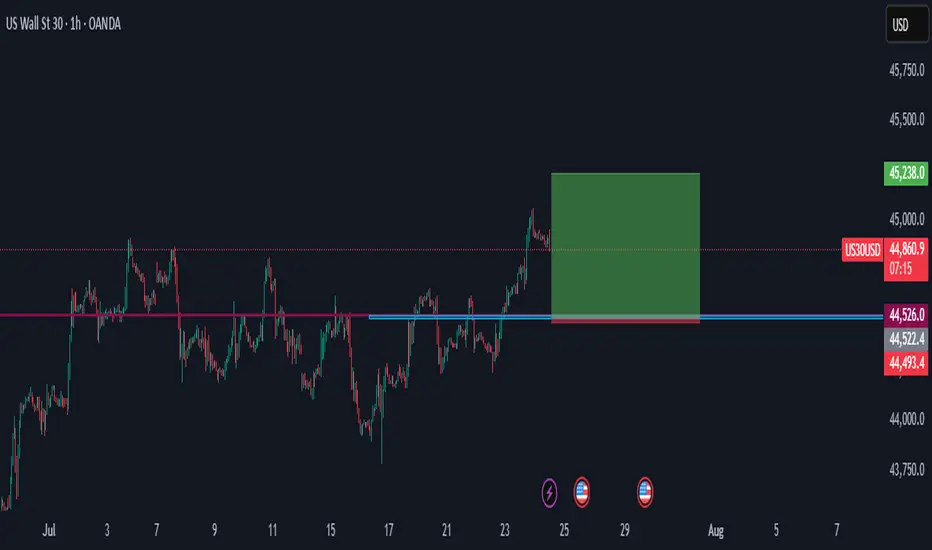
Long-Term Buy Setup
Bias: Trend continuation
Ideal Buy Zones (Fibonacci):
Zone 1: 44,400 (23.6%)
Zone 2: 43,775 – 43,550
Stop Loss: Below 43,400
Targets:
TP1: 45,250
TP2: 45,750
Reason: Market is in a bullish structure. A pullback to golden ratio (50%–61.8%) offers an ideal entry for a swing continuation. Watch for bullish confirmation at these zones.
US30 - LONGPrice has reached a key level after yesterday's push back down. Had a buyers come into the market this morning at market open before dropping once again. Expecting buyers to take back control and retest previous highs.
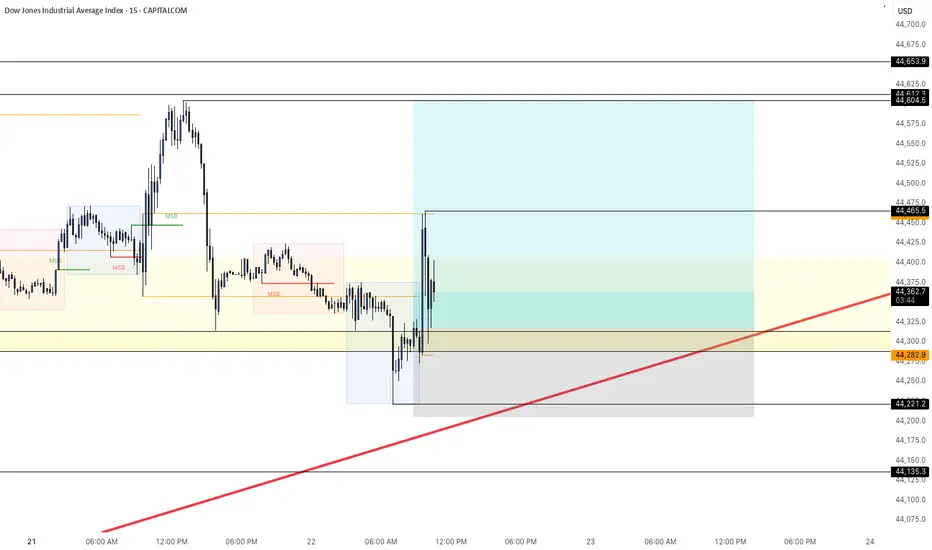
Dow Jones Index US30 Analysis:🔹 The index is approaching a key liquidity zone near 44,905 USD.
1️⃣ If price breaks and closes above 44,905, this could trigger a bullish continuation toward 45,100 USD.
2️⃣ However, if the price fails to break above and bearish momentum appears, a pullback is expected to test 44,570 and 44,320.
🔻 A confirmed break and close below 44,320 could resume the bearish trend and open the way toward 43,900 USD.
⚠️ Disclaimer:
This analysis is not financial advice. Please monitor the markets carefully before making any investment decisions.
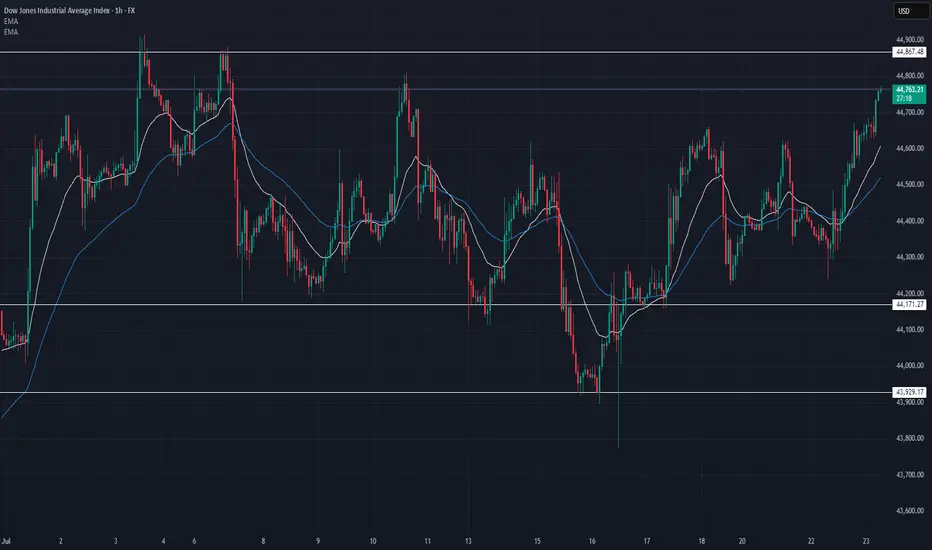
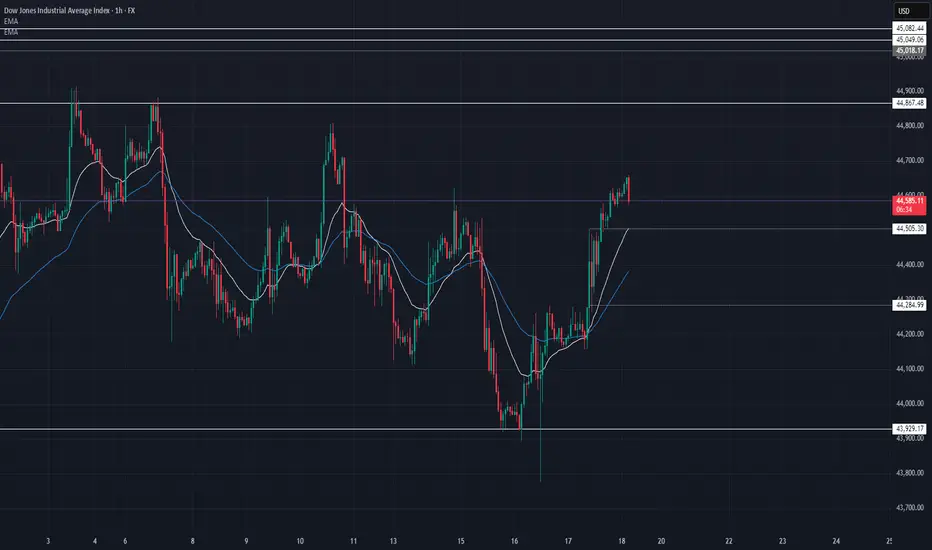
US30 Update – 07/23/2025📍 US30 Update – 07/23/2025
The bulls are back in control 🚀
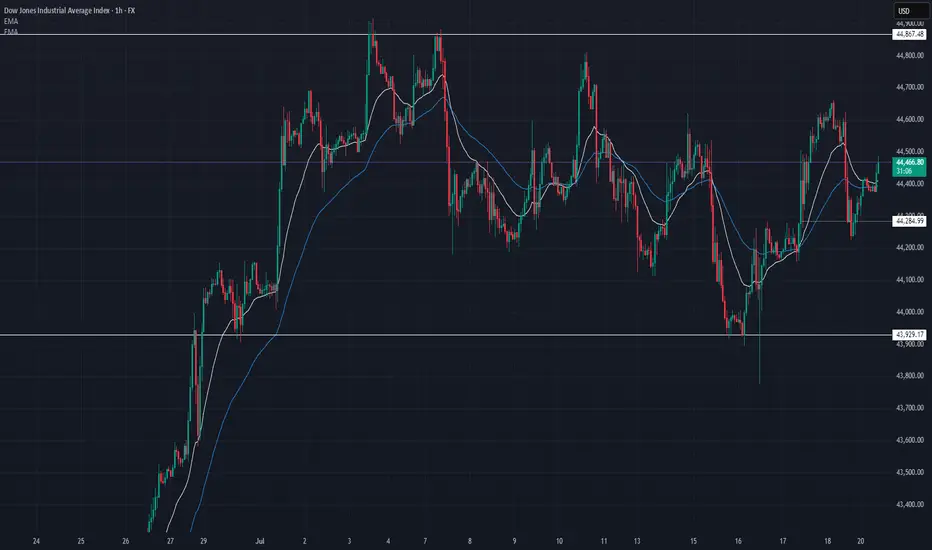
After consolidating below 44,450, we finally saw a strong breakout above the mid-range and EMAs. Price surged straight into the 44,760–44,867 resistance zone with strength, riding the 9/21 EMA crossover 🟢
We're now testing a major supply zone, so momentum traders should watch for a reaction here.
📊 Market Structure:
✅ Clean higher lows
✅ Breakout above 44,600 resistance
✅ EMAs aligned bullish on 1H
✅ Bullish engulfing + follow-through
🔑 Key Levels:
🔼 Resistance: 44,764 → 44,867
🔽 Support: 44,450 → 44,171
🧠 Market Bias:
Short-term bullish ✅
➡️ Holding above 44,600 = bullish continuation
➡️ Rejection at 44,867 = possible pullback/retest
💡 Trade Scenarios:
📈 Breakout Continuation (Aggressive Long):
Entry: Above 44,780
TP1: 44,867
TP2: 44,950
SL: Below 44,700
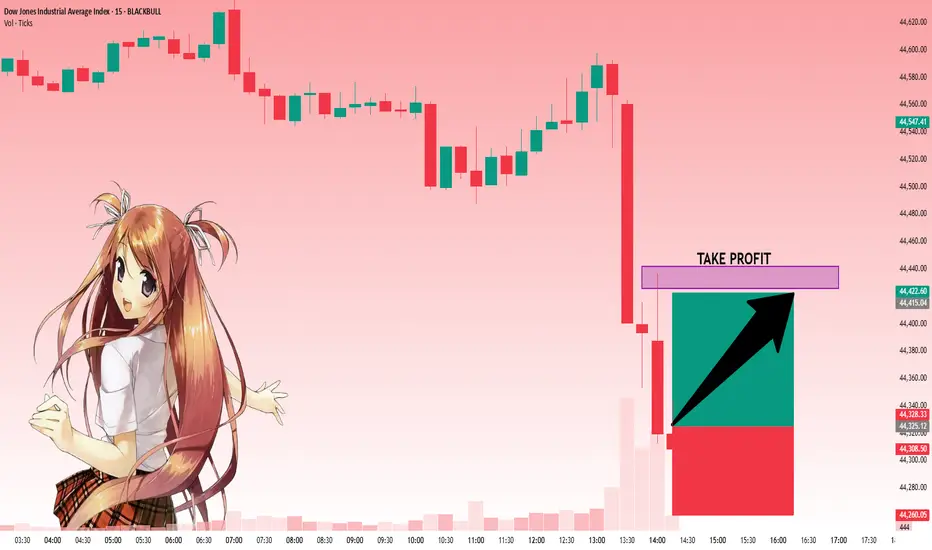
US30 SHOWING A GOOD UPWARD MOVE WITH 1:10 RISK REWARDUS30 SHOWING A GOOD UPWARD MOVE WITH 1:10 RISK REWARD
DUE TO THESE REASON
A. its following a rectangle pattern that stocked the market
which preventing the market to move any one direction now it trying to break the strong resistant lable
B. after the break of this rectangle it will boost the market potential for break
C. also its resisting from a strong neckline the neckline also got weeker ald the price is ready to break in the outer region
all of these reason are indicating the same thing its ready for breakout BREAKOUT trading are follows good risk reward
please dont use more than one percentage of your capital follow risk reward and tradeing rules
that will help you to to become a better trader
thank you
US30 BUYS!!!I see price creating a 4hr bullish structure to take price towards those equal highs because Equal Highs is a magnet for priice.

07/22 Trade for US30The variation was tricky so i had to take my patience and set the stop loss with the low of the candle bar with volume.
1. Variation(Yellow) : Downtrend losing momentum
2.Wick(Blue): Wick rejecting going down
3. Volume(Red): Wait for momentum to go up

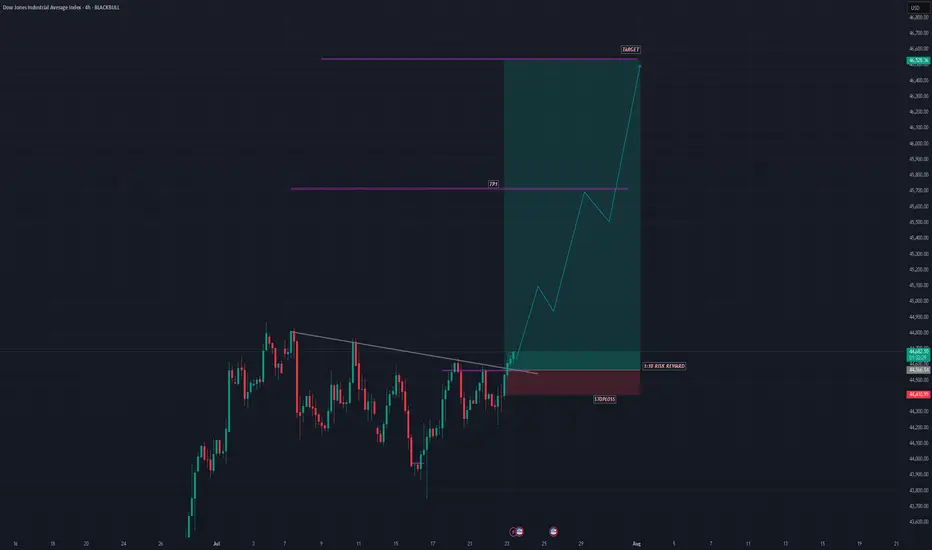
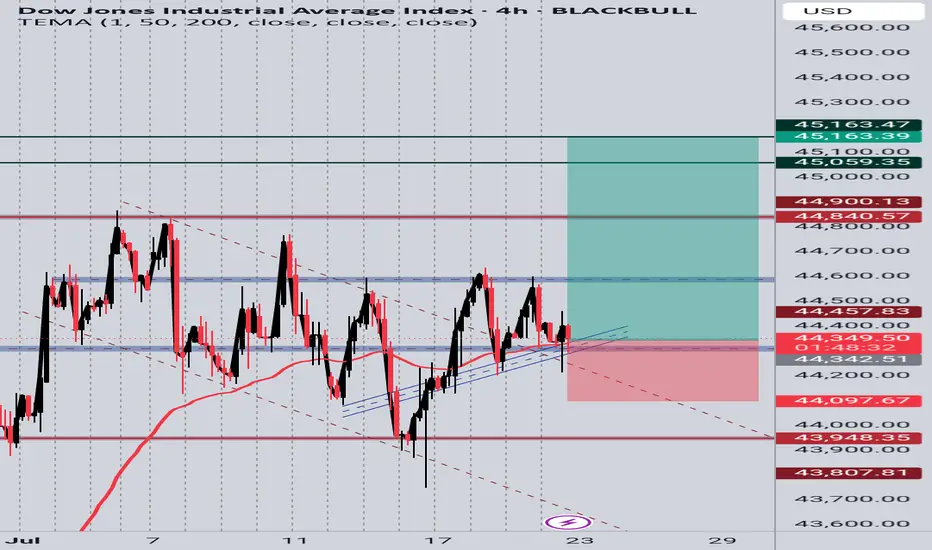
US30 4H Long SetupPrice is respecting a rising trendline and holding above a key support zone. After multiple rejections at the trendline and EMA bounce, current candle shows bullish intent. Targeting previous resistance zones around 45,059 and 45,163. SL placed below the trendline and recent structure low at 44,097. Setup based on structure support, EMA reaction, and potential bullish continuation.
US30 Update – 07/22/2025📍 US30 Update – 07/22/2025
Still trapped in the range chop ⚠️
Price rejected off 44,611 again and is now pulling back toward mid-range. Structure continues to respect key zones, and we now see lower highs forming — early signs of bearish pressure building 🐻
EMA crossover is flipping bearish on the 1H — sellers gaining control short term.
📊 Market Structure:
📉 Lower highs forming below 44,611
📈 Still above demand at 44,171
📉 EMA 9/21 crossover down — bearish tilt
📉 Momentum weak under 44,385
🔑 Key Levels:
🔼 Resistance: 44,611 → 44,867
🔽 Support: 44,171 → 43,929
🧠 Market Bias:
Short-term bearish 🧨
➡️ Clean breakdown of 44,171 = bearish momentum
➡️ Buyers must reclaim 44,385 to shift bias
💡 Trade Scenarios:
📉 Bearish Rejection Play:
Entry: 44,380–44,400
TP1: 44,200
TP2: 44,000
SL: Above 44,430
📈 Demand Bounce (Low-Risk Buy):
Entry: 44,180–44,150
TP1: 44,385
TP2: 44,600
SL: Below 44,100
US30Given the current COT data, technical indicators, and economic factors, the bias for the US30 is bearish. Traders should monitor upcoming economic reports and Federal Reserve announcements for potential shifts in market sentiment.

Possibility of uptrend It is expected that the triangle pattern will form according to the specified direction and then we will see the start of the upward trend. If the index breaks through the support area and consolidates, the continuation of the downward trend is likely.

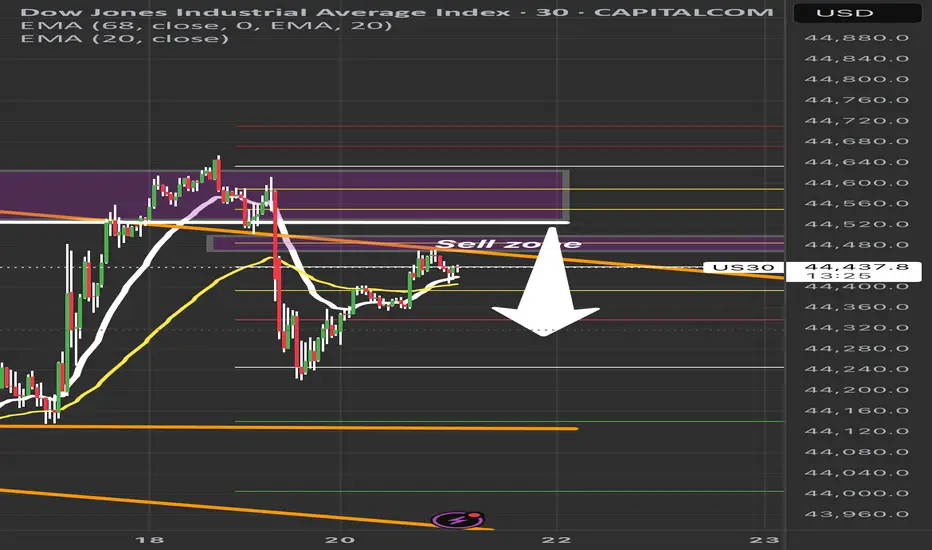
US30 Sell Setup – Watching Key Retracement ZonePrice is pulling back into a key sell zone (44,480–44,550) after a strong bearish move.
✅ Confluences:
• Previous liquidity zone
• 50–61.8% Fib retracement
• EMA rejection overhead
Plan: Waiting for bearish confirmation before short entry.
🎯 Targets:
TP1: 44,300
TP2: 44,150
TP3: 44,000
❌ Invalidation: Break above 44,600.
Patience = Precision. No confirmation, no trade.
#US30 #DowJones #TradingSetup #SmartMoneyConcepts #PriceAction #LiquidityZones #ForexTrading #DayTrading #IndicesTrading #SupplyAndDemand #TechnicalAnalysis #Fibonacci #MarketStructure #ScalpSetup #SwingTrade #RiskManagement #TradingEducation
US30 Update – 07/21/2025📍 US30 Update – 07/21/2025
Sideways chop continues on US30 🌀
We’re still range-bound between 44,285 and 44,867, with price currently hovering mid-range around 44,470. Structure remains indecisive — buyers tried to push higher but got faded near the 44,600 level again.
EMA structure is flat on the 1H — confirmation that we’re consolidating.
📊 Market Structure:
🔄 Consolidation Zone: 44,285 → 44,867
📉 Failed to hold above 44,600
📈 Bulls defending 44,285 zone (demand still active)
📊 1H EMAs flat — neutral/slightly bullish
🔑 Key Levels:
🔼 Resistance: 44,600 → 44,867
🔽 Support: 44,285 → 43,929
🧠 Market Bias:
Neutral short term ⚖️
➡️ Clear breakout above 44,867 = trend continuation
⬇️ Breakdown below 44,285 = bearish structure confirmed
💡 Trade Scenarios:
📈 Range Buy (Support Play):
Entry: 44,300–44,285
TP1: 44,500
TP2: 44,700
SL: Below 44,200
📉 Range Sell (Resistance Fade):
Entry: 44,600–44,650
TP1: 44,400
TP2: 44,300
SL: Above 44,700
⚔️ Breakout Setup:
Long above 44,870 (confirmation)
Short below 44,280 with volume
📵 No trade in the middle of the range unless scalp — wait for edges to act.
US30: Move Up Expected! Long!
My dear friends,
Today we will analyse US30 together☺️
The price is near a wide key level
and the pair is approaching a significant decision level of 44,325.14 Therefore, a strong bullish reaction here could determine the next move up.We will watch for a confirmation candle, and then target the next key level of 44,425.56.Recommend Stop-loss is beyond the current level.
❤️Sending you lots of Love and Hugs❤️
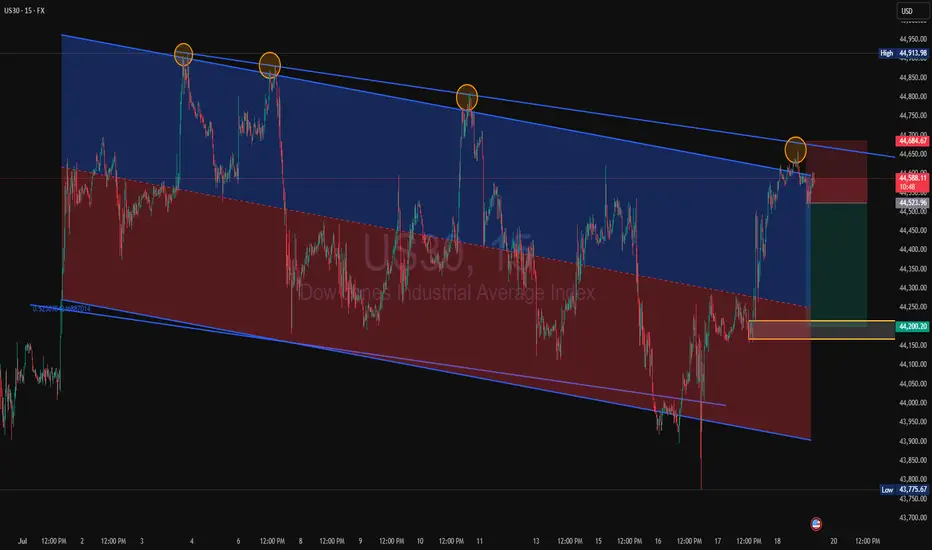
US30 Rejection at Channel Resistance US30 is showing a repeated pattern of rejection at the upper boundary of the descending channel. Price has now tapped this trendline for the fourth time, forming a consistent bearish structure.
Price rejected again at the top of the descending channel (marked by orange circles)
Clear sell setup with stop above the most recent swing high, targeting the lower channel boundary around 44,200, aligning with past demand.
Short below 44,685
Target: 44,200
Stop: Above recent highs near 44,913
Risk/Reward: Favourable if structure holds. If this pattern plays out as before, we can expect another push to the downside within the channel.
A break and retest of the midline could add extra confirmation.
#US30 #DowJones #PriceAction #SellSetup #BearishRejection #ChannelTrading #TechnicalAnalysis
US30 UNCERTAINTY We could see a possible bounce on 4465. or price could break below and target 43700
US30 Update – 07/18/2025📍 US30 Update – 07/18/2025
Massive recovery off 43,929 👀
US30 has broken above the 44,500 resistance and is holding strong around 44,590. The EMAs are now sloping bullish on the 1H — this is the first solid bullish structure since the early July top.
If buyers hold above 44,500, we could see a run to retest 44,867, the local high.
📊 Market Structure:
🔄 Bear trend possibly shifting → early signs of reversal
📈 Higher lows forming — EMAs crossed bullish
🔼 Break of 44,505 confirmed strength
🧭 Eyes now on 44,700–44,867 zone
🔑 Key Levels:
🔼 Resistance: 44,700 → 44,867
🔽 Support: 44,505 → 44,285 → 43,929
🧠 Market Bias:
Short-term bullish — but buyers must defend 44,500.
A drop below 44,285 would invalidate this move.
💡 Trade Ideas:
🔼 Long Setup – Continuation:
Entry: Pullback to 44,505–44,530
TP1: 44,700
TP2: 44,850
SL: Below 44,450
🔻 Short Setup – Fade Rejection:
Entry: Rejection at 44,700–44,850
TP1: 44,500
TP2: 44,300
SL: Above 44,900
⚠️ Patience — wait for clean retests or candle rejections at key levels. No need to force entries.
Dow Jones: Shaking amid rumors of Powell’s dismissalIon Jauregui – Analyst at ActivTrades
The main Wall Street indices closed Thursday’s session with mixed results. Comments from Trump stating he had no plans to fire Powell but “doesn’t rule anything out” except in cases of fraud, along with Powell’s declaration that he will serve his full term until mid-2026, pressured the market. The U.S. market has been dealing with these dismissal tensions for seven months, which made the Dow Jones appear weaker, while the S&P 500 and Nasdaq managed to stay in positive territory, supported by strong earnings from key companies. At the session’s start, the Dow Jones fell 0.09% to 44,202 points, while the S&P 500 rose 0.04% to 6,266 points and the Nasdaq gained 0.17% to 20,777 points. However, the Dow Jones closed at 44,484.49 points (+0.52%), the S&P 500 at 6,297.36 points (+0.54%), and the Nasdaq at 20,885.65 points (+0.75%). The day was marked by rumors from the White House, where an official stated that Trump would “probably soon” fire Jerome Powell. The news triggered an intraday drop of over 260 points in the Dow Jones, although markets later moderated losses after clarifications from the former president himself.
An early dismissal of Powell would likely impact the market very negatively and generate significant chaos. Trump’s interest in pressuring the Fed for rate cuts, although he cannot legally dismiss the central bank’s president, has been on the table since the start of his term. This has caused pronounced volatility movements. Meanwhile, the 10-year U.S. Treasury yield fell to 4.449%, as the market reduced the probability of a rate cut in September from 66% to 55% (CME FedWatch).
On the macroeconomic front, June retail sales rose 0.6%, far exceeding the expected 0.1%. Weekly jobless claims stood at 221,000, also below expectations. With these results, Trump has little leverage to challenge the Fed.
Notable corporate results:
PepsiCo surprised positively with EPS of $2.12 (vs. $2.03 expected) and rose 5.7% at the open.
United Airlines advanced 3.6%, beating earnings expectations with EPS of $3.87, although revenues slightly disappointed.
GE Aerospace raised its 2025 EPS forecast to a range of $5.60–5.80, driven by strong aftermarket demand.
Netflix reported after the close, with expectations of $7.09 EPS and $11.06 billion in revenue.
TSMC led chip sector gains, rising more than 3% after announcing record profits thanks to AI. AMD, NVIDIA, and Super Micro also traded higher.
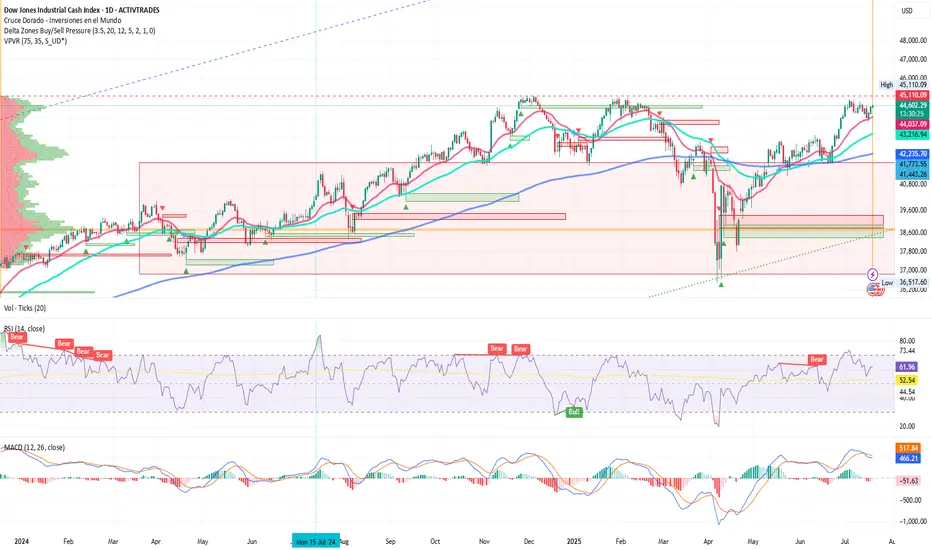
Technical Analysis
Observing the Dow Jones daily chart (Ticker AT: USAIND), since late April the index has moved upward toward its long-term control zone around 42,230 points, where the Point of Control (POC) acts as support for the current rally. In recent days, candles have used the 50-day moving average as support. The price expansion that began on June 6 with a golden cross appears solid. The bullish delta pressure zones from February and last year’s Christmas rally coincide with the current trading zone, suggesting a potential fourth attempt to break the current all-time highs at 45,110.09 points in pursuit of 46,000. If this price area is not breached, a pullback toward the POC zone could occur, and if that level fails to hold, a drop toward 39,600 points may follow.
*******************************************************************************************
La información facilitada no constituye un análisis de inversiones. El material no se ha elaborado de conformidad con los requisitos legales destinados a promover la independencia de los informes de inversiones y, como tal, debe considerarse una comunicación comercial.
Toda la información ha sido preparada por ActivTrades ("AT"). La información no contiene un registro de los precios de AT, o una oferta o solicitud de una transacción en cualquier instrumento financiero. Ninguna representación o garantía se da en cuanto a la exactitud o integridad de esta información.
Cualquier material proporcionado no tiene en cuenta el objetivo específico de inversión y la situación financiera de cualquier persona que pueda recibirlo. La rentabilidad pasada y las estimaciones no sinónimo ni un indicador fiable de la rentabilidad futura. AT presta un servicio exclusivamente de ejecución. En consecuencia, toda persona que actúe sobre la base de la información facilitada lo hace por su cuenta y riesgo. Los tipos de interés pueden cambiar. El riesgo político es impredecible. Las acciones de los bancos centrales pueden variar. Las herramientas de las plataformas no garantizan el éxito.
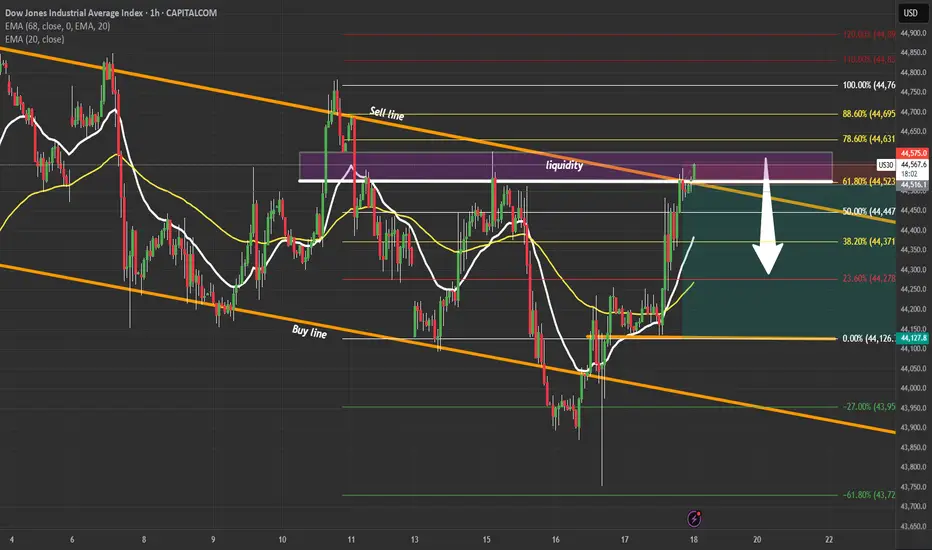
US30 High-Probability Short SetupUS30 | Liquidity Grab at 61.8% Fib 🔍
Price tapped a major liquidity zone inside the descending channel near the 61.8% Fibonacci level.
Plan: Waiting for confirmation to short toward 44,150.
Breakout or rejection? Drop your thoughts below!