Dow Jones Industrial Average Index forum
There's typically, anywhere from 1 - 3 more candles that show up after the Exhaustion candle, then the pullback occurs, which can be back towards the low of the Inside Day at 44,774 (shown as an orange line) or a bit higher, then back down again, but further down because the Hourly is still in Bearish (directional) Market Bias.
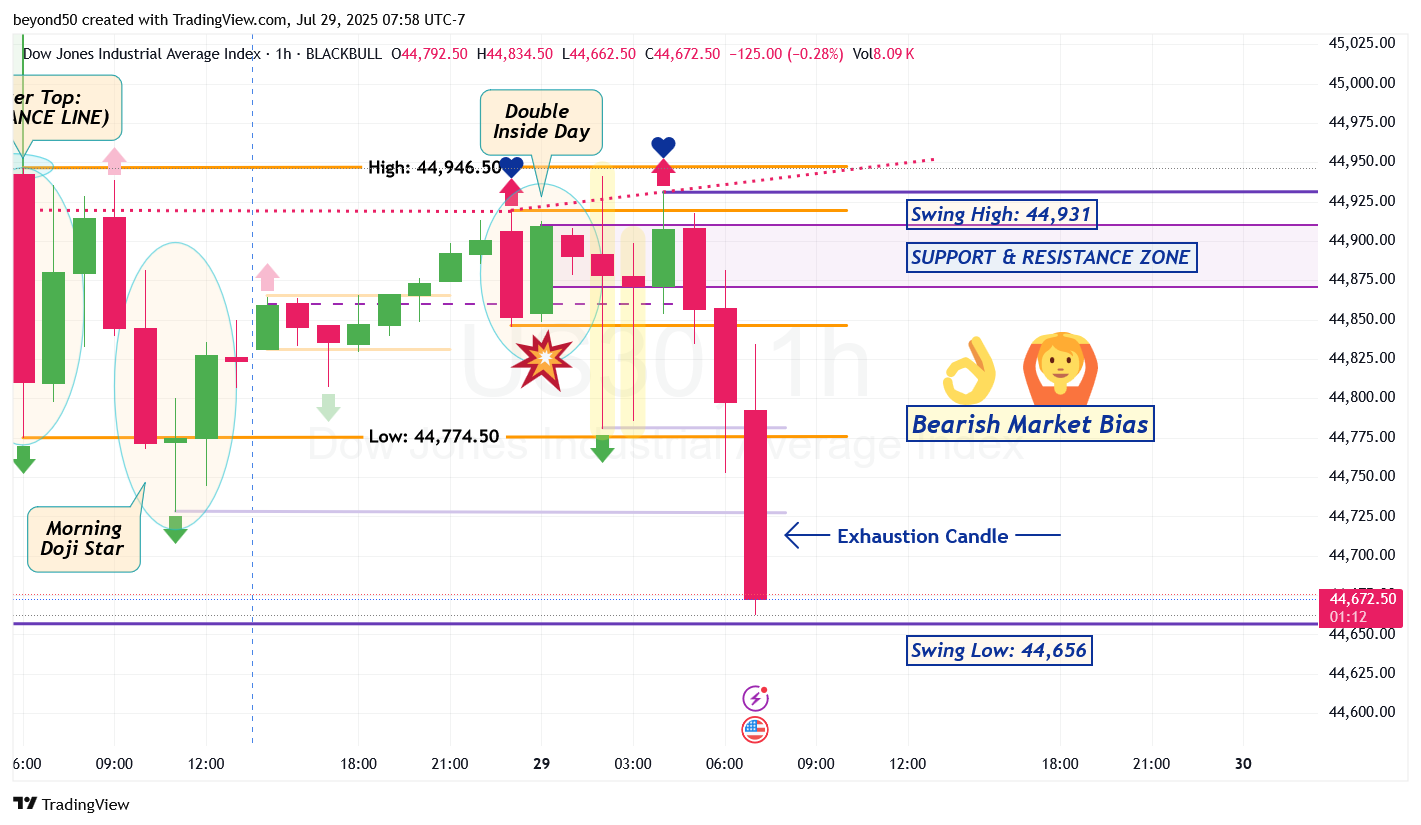
With a potential drop down towards the Swing Low of 44,622 to either breach or reject, you'll see a retrace to the upside for a retest of the trendline, then back down again, but much further.
*Side Note:
An M-shaped pattern is forming with the last and 4th leg being a long bearish trend.

Switching to the Hourly, a new S&R Zone has formed from the candles consolidating for hours within it.
You can see a "footprint" of the market makers as they like to create High Wave Spinning Tops (that are both highlighted in yellow) to throw off your analysis about direction. Don't be fooled. That pattern is a hallmark of their trick moves.
The new S&R Zone may block a move to the upside for the bearish to drop down more towards these conservative, take profit projections:
44,780 - Swing Low to Breach
44,774.50 - Inside Day Pattern's Low for a Breakout
44,727 & 44,656 - Swing Lows to Breach

Price action through consolidation is moving ever more closer to the Bullish Trendline (in green dotted line).
Let's see if we'll get a trendline break this week to flip the market bias from bullish to bearish for the most profitable moves being to the downside.
A continued drop would be to the S&R Zone (that begins at 44,533); a retrace back towards the trendline for a retest, then back down again.
