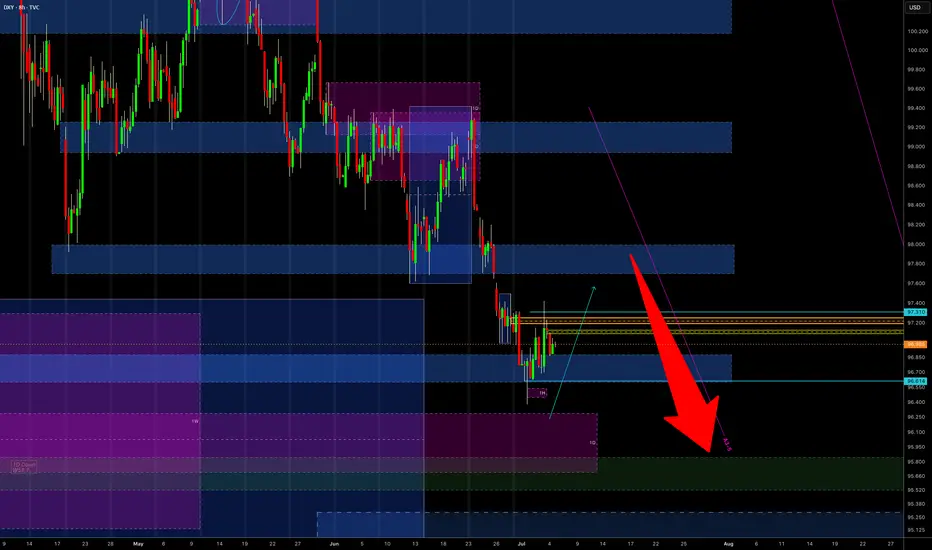
DXY shortPrice had broken our support level and hence i expect i continuous downward movement in price, although price cloud retest the support level that was turn into a resistance level before continuing it bearish move.
USDINDEX trade ideas

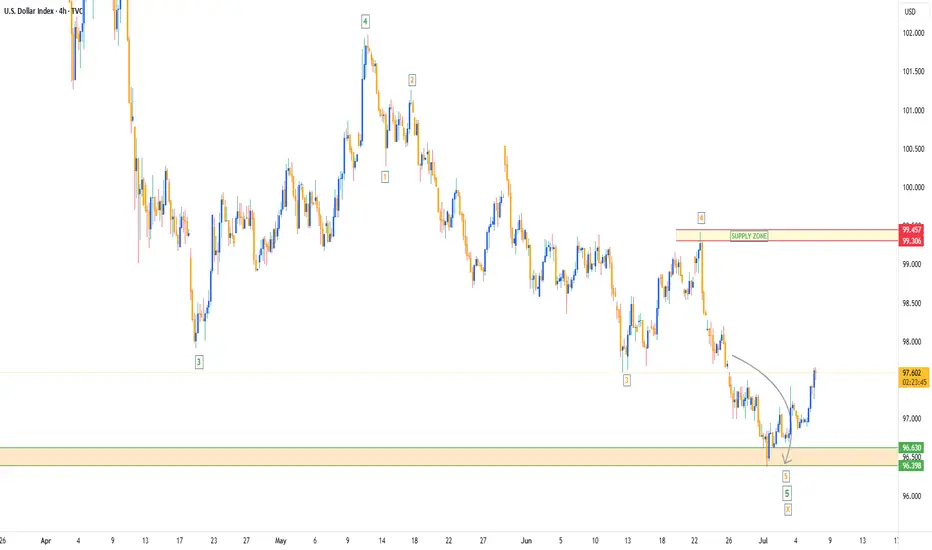
US$ Index and the Elliott Wave PrinciplesWe are on the last 'leg' of an impulse move that should contain 5 Waves and is marked in Red. After Wave 1(Red) completed, we witnessed a Zigzag correction for Wave 2(Red). This means we should expect a Flat correction for Wave 4(Red). Wave 3(Red) is extended to the 361.8% Fib. level and this is very normal for both impulse and corrective waves. When Wave 3 (Red) is complete, a shallow correction appears and this is the first wave of the Flat correction. This is marked in Green. Wave B(Green) reaches the 423.6% Fib. level(which is normal) and in doing so extends beyond the end of wave 3(Red), which is also according to the rules of a Flat correction. At the 423.6% Fib. level, this level is also 100% of the inner zigzag from points A to B(Green). At this area we see a retest and confirmation take place, which marks the end of Wave B(Green) and the start of Wave C(Green) which is also Wave 4(Red).

DXY Short From Resistance! Sell!
Hello,Traders!
DXY made a nice rebound
From the lows but will soon
Hit a horizontal resistance
Around 97.900 from where
We will be expecting a
Local bearish correction
Sell!
Comment and subscribe to help us grow!
Check out other forecasts below too!
Disclosure: I am part of Trade Nation's Influencer program and receive a monthly fee for using their TradingView charts in my analysis.

Dollar Index OverviewThe Dollar moving as we expect it to within the Gold Fund! As soon as we saw a '5 Bearish Wave Completion' on the DXY, straight away buyers entered the market & start pushing price back up.
My Gold Fund investors & Gold Vault Academy students know from our 'Q3 Market Breakdown Report' what we're expecting for the Dollar in the next 3 months.
Major resistance level ahead?US Dollar Index (DXY) is rising towards the pivot and could reverse to the 1st support.
Pivot: 97.90
1st Support: 96.46
1st Resistance: 98.57
Risk Warning:
Trading Forex and CFDs carries a high level of risk to your capital and you should only trade with money you can afford to lose. Trading Forex and CFDs may not be suitable for all investors, so please ensure that you fully understand the risks involved and seek independent advice if necessary.
Disclaimer:
The above opinions given constitute general market commentary, and do not constitute the opinion or advice of IC Markets or any form of personal or investment advice.
Any opinions, news, research, analyses, prices, other information, or links to third-party sites contained on this website are provided on an "as-is" basis, are intended only to be informative, is not an advice nor a recommendation, nor research, or a record of our trading prices, or an offer of, or solicitation for a transaction in any financial instrument and thus should not be treated as such. The information provided does not involve any specific investment objectives, financial situation and needs of any specific person who may receive it. Please be aware, that past performance is not a reliable indicator of future performance and/or results. Past Performance or Forward-looking scenarios based upon the reasonable beliefs of the third-party provider are not a guarantee of future performance. Actual results may differ materially from those anticipated in forward-looking or past performance statements. IC Markets makes no representation or warranty and assumes no liability as to the accuracy or completeness of the information provided, nor any loss arising from any investment based on a recommendation, forecast or any information supplied by any third-party.

DOLLAR DOLLAR index is holding strong and US10Y doing the same .we keep eye on price movement and take action.

DXY: Bears Are Winning! Short!
My dear friends,
Today we will analyse DXY together☺️
The recent price action suggests a shift in mid-term momentum. A break below the current local range around 96.860 will confirm the new direction downwards with the target being the next key level of 96.760.and a reconvened placement of a stop-loss beyond the range.
❤️Sending you lots of Love and Hugs❤️

Potential USD Strengthening Ahead | DXY vs BTCUSD Outlook
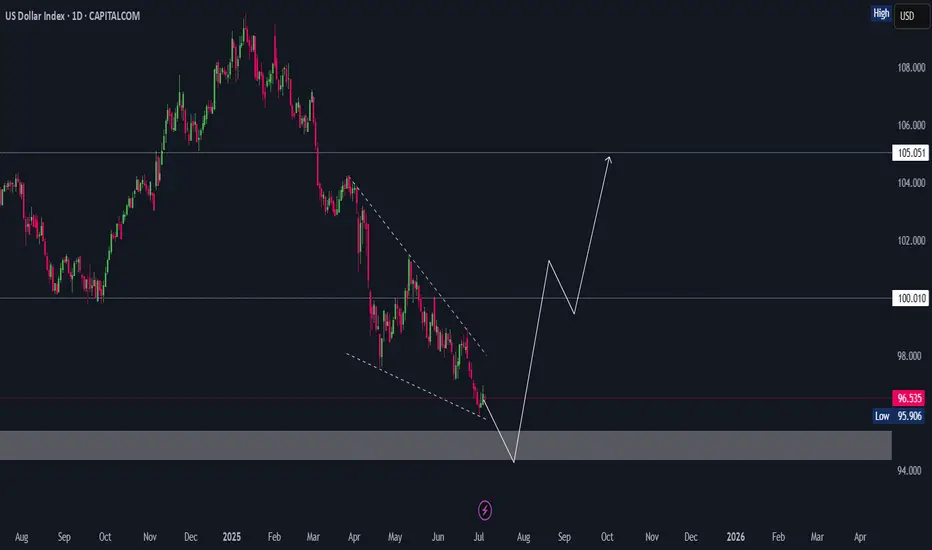
⚡ The DXY has now reached the lower boundary of its long-term ascending channel, a historically significant technical zone where rebounds have occurred in the past.
💡 If this pattern holds, a strong rebound towards the 121 level on the DXY looks probable in the coming months.
What does this mean for BTC?
Historically, a strengthening USD has often resulted in a reciprocal effect on BTCUSD, leading to downward pressure on Bitcoin prices. The chart suggests that if the DXY rebounds as expected, BTCUSD could witness a significant decline proportionate to the USD's strength.
Key Takeaways:
✅ DXY at crucial technical support – rebound likely.
✅ Target for DXY: 121 zone.
✅ BTCUSD may face downside pressure as USD strengthens.
✅ MACD showing early signs of bullish reversal potential for DXY.
Note: This is a technical analysis-based view. Always use risk management and combine multiple factors before trading decisions. For Educational purpose only.
💬 What are your thoughts? Will the USD rally put pressure on Bitcoin again? Share below!

Check the trend It is expected that a trend change will form at the current resistance level and a continuation of the downtrend will form. Otherwise, the continuation of the uptrend to the specified resistance levels will be possible and then there will be a possibility of a trend change at the specified resistance levels.

DXY // Inverted head and shoulders formationIf we can see closings above the green line, the first target exit is 97.878, which corresponds to Fibo 1.414, and the main target is 98.363.

3 key reasons why the U.S. dollar is losing value📉 According to J.P. Morgan, here are 3 key reasons why the U.S. dollar is losing value:
1️⃣ Oil and energy deals are now being done in other currencies
2️⃣ U.S. banks are excluded from new global payment systems
3️⃣ Countries are reducing their USD reserves
The world is slowly shifting away from dollar dependence...
#USD #DollarDecline #JPMorgan #ForexNews #DeDollarization #OilTrade #CurrencyShift #GlobalEconomy #SmartMoney #FXForever #MarketUpdate #ForexTraders #USDBreakdown #EconomicTrends #GlobalFinance

DXY TrendlinesUnless it brakes the downtrend with a weekly candle close it should bounce back up in long run. should be closely monitored since it will give us a lot of information about current market direction. i expect bouncing back up but we will see.

US DOLLAR ANALYSIS !!The US Dollar has broken below its ascending channel structure. The Ichimoku Cloud is now serving as a resistance zone, suggesting ongoing bearish pressure. If the retest of the broken pattern holds, further downside movement is likely.
Given the usual inverse relationship between the US Dollar and the cryptocurrency market, this development could carry notable implications for crypto traders.
Stay alert!

DOLLAR INDEX The dxy is the measure of the united state dollar relative to basket of six majors foreign currencies, it was originally developed by U.S Federal Reserve in 1973 to provide a trade -weighted average value of the dollar against global currencies.
the six currencies are EURO 57%,JPY 13.6%,GBP 11.9%,CAD 9.1% SEK 4.2% CHF 3.6%
The index rises when the dollar strengthens against these currencies and falls when it weakens ,its used to gauge the overall strength of the us dollar in the global market.
US10Y
THE US10Y ,the treasury note yield is the interest rate the U.S government pays to borrow money for 10 years ,it serves as a crucial benchmark for other interest rates and is a key indicator of the investor sentiment about the economy, in context it reflects the return an investor expect for lending money to the U.S. government for a decade .
the interest is paid semi annually at a fixed coupon rate and the yield moves inversely to bond price; when bond price fall the yield rises, and vice versa .
this have a direct effect on borrowing cost across the economy ,including mortgage rates and corporate loans .
when yield is rising investor optimism is high about the economic growth and inflation ,while failing yield indicates economic caution and recession fear and concern
technical interpretation of the monthly chart
the dxy is in buy back position on ascending trendline line ,but price remains below supply roof and if we get monthly retest of broken demand floor we could see price selling off.
trading is 100% probability.

DOLLAR INDEX TRADING CHEACK LIST.
The dxy is the measure of the united state dollar relative to basket of six majors foreign currencies, it was originally developed by U.S Federal Reserve in 1973 to provide a trade -weighted average value of the dollar against global currencies.
the six currencies are EURO 57%,JPY 13.6%,GBP 11.9%,CAD 9.1% SEK 4.2% CHF 3.6%
The index rises when the dollar strengthens against these currencies and falls when it weakens ,its used to gauge the overall strength of the us dollar in the global market.
US10Y
THE US10Y ,the treasury note yield is the interest rate the U.S government pays to borrow money for 10 years ,it serves as a crucial benchmark for other interest rates and is a key indicator of the investor sentiment about the economy, in context it reflects the return an investor expect for lending money to the U.S. government for a decade .
the interest is paid semi annually at a fixed coupon rate and the yield moves inversely to bond price; when bond price fall the yield rises, and vice versa .
this have a direct effect on borrowing cost across the economy ,including mortgage rates and corporate loans .
when yield is rising investor optimism is high about the economic growth and inflation ,while failing yield indicates economic caution and recession fear and concern
technical interpretation of the monthly chart
the dxy is in buy back position on ascending trendline line ,but price remains below supply roof and if we get monthly retest of broken demand floor we could see price selling off.
trading is 100% probability.

DXY Bullish IdeaDXY has been printing Lows since past weeks and is currently testing a good long term support. A good bounce is expected in dollar.
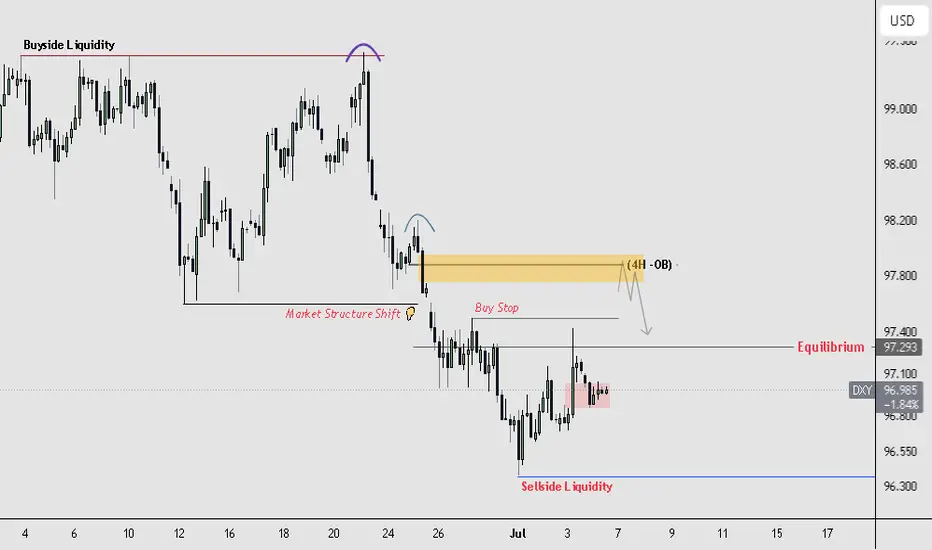
DXY 4H BEARISH SETUPDXY is still bearish. I’m watching for a retracement into the 4H OB, where I expect price to reject and continue the bearish move toward the 96.30 level..
DXY Weekly ForecastDXY Weekly Forecast
- look for down move when reaching 98.00 level
A Message To Traders:
I’ll be sharing high-quality trade setups for a period time. No bullshit, no fluff, no complicated nonsense — just real, actionable forecast the algorithm is executing. If you’re struggling with trading and desperate for better results, follow my posts closely.
Check out my previously posted setups and forecasts — you’ll be amazed by the high accuracy of the results.
DXY 4Hour TF - July 6th, 2025DXY 7/6/2025
DXY 4hour Bearish Idea
Monthly - Bearish
Weekly - Bearish
Dailly - Bearish
4hour - Bearish
All timeframes are suggesting we are sitll very much bearish. Going into this week we can spot two scenarios that will consider DXY either bullish or bearish.
Bearish Continuation - Ideally we can see price action stay below our 97.500 resistance zone which is also our 38.2% fib level. Look for price action to reject 97.500 with strong bearish conviction. This will most likely confirm a bearish dollar for the week ahead. Keep in mind, price action can push up to the 98.000 zone and still remain bearish.
Reversal - This is the less likely move for the week ahead but not impossible. For us to consider DXY bullish again on the 4hour timeframe we would need to see price action push above our 98.000 resistance area with a confirmed higher low above. Look for strong bullish rejection above & off of 98.000 acting as support. This is the first step for DXY in becoming bullish again.

$DXY: New lows begets new lows. $USM2: Why is it increasing? Here we are again with one more TVC:DXY chart analysis. I think the US Dollar does not fail to surprise us week after week. Making new lows every week is giving a boost to the Equity markets. The SP:SPX and NASDAQ:QQQ are at ATH. In my articles on April 18 and June 16
Perfect trade setup: AMEX:GLD to 325; DXY to 95 for AMEX:GLD by RabishankarBiswal
TVC:DXY weakness and EM markets: NSE:NIFTY more upside? for NSE:NIFTY by RabishankarBiswal — TradingView
We have time and again said that in the near term TVC:DXY chart looks weak and could touch 95 by end of July. I think it might be achieved earlier. We have looked at the consequences of 95 handle on TVC:DXY on various asset classes like AMEX:GLD , NSE:NIFTY and EMs. These asset classes are reaching ATH every single week. But we have seldom investigated the reason behind the weakness in $DXY. Looking through my macro charts I found an amazing chart which might explain most of this weakness.
The ECONOMICS:USM2 is almost at 22 T $ surpassing its previous high on March 2022. M2 is basically the total amount of money in circulation in the economy on top of the nominal M1. Higher M2 indicates higher amount of liquidity which is then channelized into riskier assets like CRYPTOCAP:BTC , AMEX:GLD , SP:SPX , NASDAQ:QQQ and EMS like $NIFTY. And with such high ECONOMICS:USM2 in circulation, it is very clear why TVC:DXY is making new lows each week. This can also explain why US Fed is hesitant to reduce rates. With M2 so high US Fed should not hurry.
Verdict: TVC:DXY to 95 by 31 July, Cycle low of 90 by year end. ECONOMICS:USM2 keeps increasing. US Fed stays put.

DXYDXY still needs more correction upside, once we see more upside we will see if dollar is ready for one last drop.
Disclosure: We are part of Trade Nation's Influencer program and receive a monthly fee for using their TradingView charts in our analysis.

We can expect such a move if the event I mentioned in the captioHello friends..
In the analysis we had previously told you about the dollar index on this page, it started a downward trend right from the specified area (you can visit the page)
Now, after a long time has passed since that analysis, we are now in a suitable range in the dollar index.
See, on the weekly time frame, the index number has hit a strong support area, but we should not make a trading decision by seeing this support unit.
As you can see in the image, if the index number suffers in this range, we can expect a turn in the index.
You can change the trading decisions you have had so far in the event of a turn in the index.
This is just a view from our team, do not attach it to your trades.
.
.
Follow our page to see more analyses.

DXY LONG TERM ANALYSISI anticipate dollar to trade down towards 80. After which we shall look for longs towards 144. This is a long term outlook.
1. first we trade down towards sellside liquidity at 87.
2. Next key level is the 3 month fair value gap at 84
3. Eventually hitting the 25 DRT of the current dealing range at 80.
4. Then we can look to go long targeting 75 DRT of the parent Dealing Range.
5. We shall be coming here weekly to review and correct course as the market unfolds.
THANK YOU.
