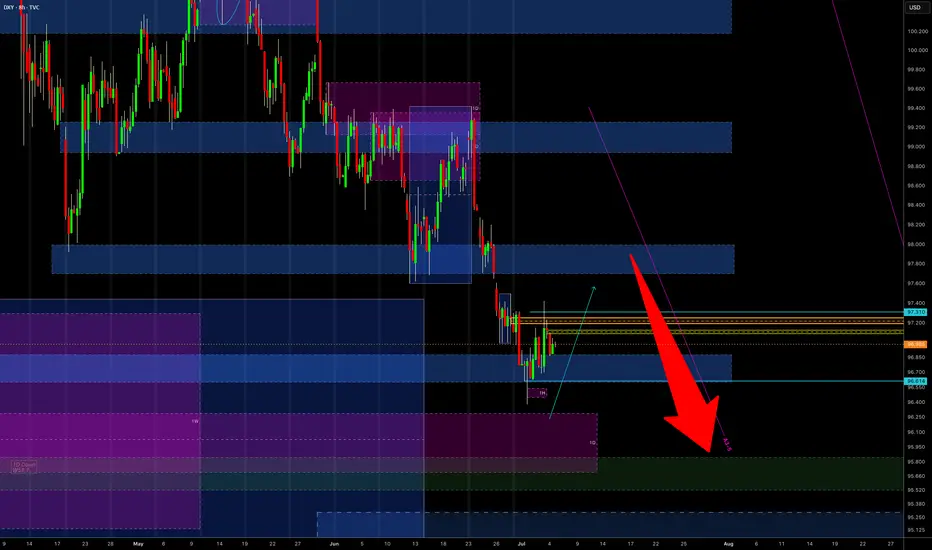
DXYDXY still needs more correction upside, once we see more upside we will see if dollar is ready for one last drop.
Disclosure: We are part of Trade Nation's Influencer program and receive a monthly fee for using their TradingView charts in our analysis.
USDINDEX trade ideas

DXY (LONG)
Elephant in room: To all the fake Business Development Managers in SA; claiming to have database/business they dont have, then jumping broker to broker every 3months to just get money knowing very well you cannot meet the requirement to claim you can
have caused the following
1) International brokers to not hire South Africans anymore
2) Some good brokers to leave the country therefore jobs opportunities to be lost.
We complain about lack of employment and opportunities while we are greatly the cause
Be Better have integrity, professionalism and be hournest, your selfish acts have a greater negative impact than you can imagine.

US dollar, Trump has done it!Since the start of 2025, the US dollar has established itself as the weakest major currency on the Forex market, falling by over 11% against a basket of major currencies. If we extend the reference period to include Donald Trump's return to the presidency, the slide even reaches 12%. This spectacular decline is no accident, but the fruit of a strategy deliberately implemented by the Trump administration. The stated aim is clear: to restore the commercial competitiveness of American companies, boost exports and restore the price advantage of products made in the USA. In this respect, the fall of the US dollar on the FX has fulfilled its mission. Can we now envisage a low point for the US dollar on the FX?
1) US dollar: the battle for currency competitiveness has been won for US companies, and this should have a positive impact on the second-quarter results of S&P 500 companies published this July
Indeed, the fall in the dollar translates directly into a much more favorable environment for exporting groups, particularly those which generate the bulk of their sales in Europe or Asia. The conversion of foreign currencies into dollars mechanically boosts revenues and margins. For many multinationals, this factor is likely to contribute to strong earnings releases in the second quarter, as the reporting period takes place this summer. Beyond the immediate impact on corporate accounts, the greenback's depreciation is also encouraging a more structural trend towards reindustrialization and support for domestic production. The effects of this dynamic can already be seen in certain manufacturing segments, which are regaining international market share. Nevertheless, this scenario is not without its downsides: a weak dollar makes imports more expensive, especially raw materials, and weighs on companies dependent on foreign inputs. On the whole, however, the exchange rate policy implemented since January represents a successful gamble by Donald Trump to boost American competitiveness.
2) Technical analysis: can we anticipate a low point for the US dollar?
The crucial question today is whether the US dollar can pull back further, or whether a technical and fundamental bottom is emerging. From a technical analysis point of view, the DXY index, which measures the value of the dollar against a basket of currencies weighted 57% by the euro and 13% by the yen, remains anchored in a bearish trend. Some of the theoretical targets evoked by Elliottist analysis have been reached, but not all. However, long-term supports are visible on monthly charts: an uptrend line, particularly visible on the arithmetic scale, could act as a short-term stabilizer. Note that a potential bullish divergence is also possible on the weekly timeframe. But a bullish reversal pattern is still lacking to speak of a major low point, so let's not put the cart before the horse.
3) Scenarios and stakes for the rest of the year for the US dollar on FX
Beyond technical considerations, the persistent weakness of the US dollar acts as a revealing indicator of the tensions between trade policy and financial stability. On the one hand, a dollar under pressure is a powerful lever for supporting exports and consolidating US growth in an uncertain global context. On the other, a prolonged fall in the greenback fuels concerns about international confidence in dollar-denominated assets, and makes imports more expensive, which could rekindle inflationary pressures. This dilemma lies at the heart of the forthcoming trade-offs between the White House and the Federal Reserve.
For investors and companies exposed to Forex, several scenarios are conceivable. If the U.S. political agenda leads to a trade compromise, and if second-quarter publications confirm the robustness of the U.S. economy, the dollar is likely to find a technical floor around the supports identified on the DXY. In this scenario, a stabilization phase, or even a moderate rebound, could set in during the second half of the year. Conversely, if the trade stimulus policy is accompanied by a hardening of relations with Europe and China, or if the Fed is slow to react, the downward momentum could be prolonged.
DISCLAIMER:
This content is intended for individuals who are familiar with financial markets and instruments and is for information purposes only. The presented idea (including market commentary, market data and observations) is not a work product of any research department of Swissquote or its affiliates. This material is intended to highlight market action and does not constitute investment, legal or tax advice. If you are a retail investor or lack experience in trading complex financial products, it is advisable to seek professional advice from licensed advisor before making any financial decisions.
This content is not intended to manipulate the market or encourage any specific financial behavior.
Swissquote makes no representation or warranty as to the quality, completeness, accuracy, comprehensiveness or non-infringement of such content. The views expressed are those of the consultant and are provided for educational purposes only. Any information provided relating to a product or market should not be construed as recommending an investment strategy or transaction. Past performance is not a guarantee of future results.
Swissquote and its employees and representatives shall in no event be held liable for any damages or losses arising directly or indirectly from decisions made on the basis of this content.
The use of any third-party brands or trademarks is for information only and does not imply endorsement by Swissquote, or that the trademark owner has authorised Swissquote to promote its products or services.
Swissquote is the marketing brand for the activities of Swissquote Bank Ltd (Switzerland) regulated by FINMA, Swissquote Capital Markets Limited regulated by CySEC (Cyprus), Swissquote Bank Europe SA (Luxembourg) regulated by the CSSF, Swissquote Ltd (UK) regulated by the FCA, Swissquote Financial Services (Malta) Ltd regulated by the Malta Financial Services Authority, Swissquote MEA Ltd. (UAE) regulated by the Dubai Financial Services Authority, Swissquote Pte Ltd (Singapore) regulated by the Monetary Authority of Singapore, Swissquote Asia Limited (Hong Kong) licensed by the Hong Kong Securities and Futures Commission (SFC) and Swissquote South Africa (Pty) Ltd supervised by the FSCA.
Products and services of Swissquote are only intended for those permitted to receive them under local law.
All investments carry a degree of risk. The risk of loss in trading or holding financial instruments can be substantial. The value of financial instruments, including but not limited to stocks, bonds, cryptocurrencies, and other assets, can fluctuate both upwards and downwards. There is a significant risk of financial loss when buying, selling, holding, staking, or investing in these instruments. SQBE makes no recommendations regarding any specific investment, transaction, or the use of any particular investment strategy.
CFDs are complex instruments and come with a high risk of losing money rapidly due to leverage. The vast majority of retail client accounts suffer capital losses when trading in CFDs. You should consider whether you understand how CFDs work and whether you can afford to take the high risk of losing your money.
Digital Assets are unregulated in most countries and consumer protection rules may not apply. As highly volatile speculative investments, Digital Assets are not suitable for investors without a high-risk tolerance. Make sure you understand each Digital Asset before you trade.
Cryptocurrencies are not considered legal tender in some jurisdictions and are subject to regulatory uncertainties.
The use of Internet-based systems can involve high risks, including, but not limited to, fraud, cyber-attacks, network and communication failures, as well as identity theft and phishing attacks related to crypto-assets.

DXY strengthens but can it break THIS key level?The US dollar has gained ground this week, with the Dollar Index rising to retest the previously broken April low near the 97.92 level—an important technical zone. The short-term bias would flip to being bullish if this area breaks.
The greenback’s strength has been underpinned in part by unexpectedly strong economic data. For instance, Thursday’s weekly jobless claims came in at 227,000, below the forecast of 235,000. This marks the fourth consecutive weekly decline and the lowest reading in seven weeks, reinforcing the view that the US labour market remains tighter than anticipated.
Adding to this backdrop are President Trump’s threats of higher tariffs and expansive fiscal plans—described as “big, beautiful” spending and tax initiatives. These factors increase the risk of more persistent inflation.
While the Federal Reserve is still widely expected to initiate rate cuts in September, the rising inflationary pressures could slow the pace of easing thereafter. This shift would likely provide support for the dollar so long as investors don't lose trust in US monetary policy.
By Fawad Razaqzada, market analyst with FOREX.com

DXY DOLLAR INDEX The DXY has declined from its current high 114.54 to 96.59 reflecting a weaker dollar against a basket of major currencies including the euro, yen, pound, Canadian dollar, Swedish krona, and Swiss franc.
Despite this decline, the dollar remains supported by strong US economic growth and higher US 10-year bond yields, which have widened the yield gap with other developed economies .
The Federal Reserve’s monetary policy has been relatively hawkish, with fewer rate cuts priced in compared to other central banks, helping to underpin the dollar.
Trade tensions and tariff uncertainties continue to create volatility, but the dollar benefits from safe-haven demand amid global uncertainties
Composition of the DXY Basket:
Euro (EUR): 57.6%
Japanese Yen (JPY): 13.6%
British Pound (GBP): 11.9%
Canadian Dollar (CAD): 9.1%
Swedish Krona (SEK): 4.2%
Swiss Franc (CHF): 3.6%
context
Drivers: US economic strength, Fed policy, bond yield differentials, trade tensions, and safe-haven flows keeping dollar on support hold.
Ongoing US tariff announcements and trade policy changes have contributed to volatility and risk aversion, pressuring the dollar lower.
US Economic Policy the Market is concerned about fiscal policy, Federal Reserve independence, and rising US debt which have led to reduced demand for US assets, further weighing on the dollar.
Interest Rate Differential:
The US Fed funds rate remains at 4.50%-4.25%, but with global central banks adjusting policy, the relative appeal of the dollar has diminished.
Conversely, a sustained move above 98.00 could signal a reversal and renewed dollar strength.
hope we can get back to 100 aagin.
#dollar

We can expect such a move if the event I mentioned in the captioHello friends..
In the analysis we had previously told you about the dollar index on this page, it started a downward trend right from the specified area (you can visit the page)
Now, after a long time has passed since that analysis, we are now in a suitable range in the dollar index.
See, on the weekly time frame, the index number has hit a strong support area, but we should not make a trading decision by seeing this support unit.
As you can see in the image, if the index number suffers in this range, we can expect a turn in the index.
You can change the trading decisions you have had so far in the event of a turn in the index.
This is just a view from our team, do not attach it to your trades.
.
.
Follow our page to see more analyses.

DOLLAR INDEX TRADING CHEACK LIST.
The dxy is the measure of the united state dollar relative to basket of six majors foreign currencies, it was originally developed by U.S Federal Reserve in 1973 to provide a trade -weighted average value of the dollar against global currencies.
the six currencies are EURO 57%,JPY 13.6%,GBP 11.9%,CAD 9.1% SEK 4.2% CHF 3.6%
The index rises when the dollar strengthens against these currencies and falls when it weakens ,its used to gauge the overall strength of the us dollar in the global market.
US10Y
THE US10Y ,the treasury note yield is the interest rate the U.S government pays to borrow money for 10 years ,it serves as a crucial benchmark for other interest rates and is a key indicator of the investor sentiment about the economy, in context it reflects the return an investor expect for lending money to the U.S. government for a decade .
the interest is paid semi annually at a fixed coupon rate and the yield moves inversely to bond price; when bond price fall the yield rises, and vice versa .
this have a direct effect on borrowing cost across the economy ,including mortgage rates and corporate loans .
when yield is rising investor optimism is high about the economic growth and inflation ,while failing yield indicates economic caution and recession fear and concern
technical interpretation of the monthly chart
the dxy is in buy back position on ascending trendline line ,but price remains below supply roof and if we get monthly retest of broken demand floor we could see price selling off.
trading is 100% probability.

DXY // Inverted head and shoulders formationIf we can see closings above the green line, the first target exit is 97.878, which corresponds to Fibo 1.414, and the main target is 98.363.

DXY (Dollar Index) longs to shortsThe dollar has been bearish for several weeks, but we’re now starting to see signs of a potential retracement due to price being in oversold territory. Last week, DXY reacted from a key weekly demand level, suggesting that we could see some short-term bullish movement before any continuation to the downside.
I’ll be watching closely for price to either push higher into liquidity or retrace slightly deeper into more discounted demand zones for a cleaner long setup. This would also align with my short setups across other major pairs, making DXY strength a key narrative this week.
Confluences for DXY Longs:
DXY has been bearish for an extended period — now showing signs of accumulation on higher timeframes
Price may retrace upwards to collect liquidity before continuing its macro downtrend
Recently reacted from a major weekly demand zone
Imbalances and liquidity above, including Asia highs, remain untapped
P.S. If price fails to react from any of my current POIs, I’ll patiently wait for new zones to develop and adjust accordingly — always staying aligned with what price tells us.
Let’s stay sharp and crush the week ahead!

DXY Short From Resistance! Sell!
Hello,Traders!
DXY made a nice rebound
From the lows but will soon
Hit a horizontal resistance
Around 97.900 from where
We will be expecting a
Local bearish correction
Sell!
Comment and subscribe to help us grow!
Check out other forecasts below too!
Disclosure: I am part of Trade Nation's Influencer program and receive a monthly fee for using their TradingView charts in my analysis.

DXY Potential Bullish Reversal – Target 99.456 DXY Potential Bullish Reversal – Target 99.456 🎯
Technical Analysis Overview:
🔹 Trend Structure:
The chart illustrates a recent downtrend, which has been broken as price moved above the descending trendline, signaling a potential trend reversal.
🔹 Pattern Insight:
A bullish harmonic pattern is visible (possibly a bullish Bat or Gartley), with the price reacting from the PRZ (Potential Reversal Zone), aligning with key support near 96.500. The market has respected this zone multiple times, evident from the orange highlighted circles showing price rejections.
🔹 Support & Resistance:
Support Zone: ~96.500
Breakout Zone: ~96.985 (current consolidation near this resistance)
Target Zone: Marked at 99.456, which aligns with previous structure and fib projection.
🔹 Market Sentiment:
Price is consolidating after breaking the downtrend, forming a bullish rectangle (accumulation). The green arrows indicate bullish intent from buyers defending support levels.
🔹 Price Action Signal:
Formation of higher lows.
Break of structure and close above previous highs.
Possible breakout pending above consolidation box.
📊 Conclusion:
DXY shows bullish potential as it builds a base around strong support. A confirmed breakout above the rectangle could fuel a rally toward 99.456. Keep an eye on volume and confirmation candles for entry. ✅

DXY: The Market Is Looking Down! Short!
My dear friends,
Today we will analyse DXY together☺️
The in-trend continuation seems likely as the current long-term trend appears to be strong, and price is holding below a key level of 97.054 So a bearish continuation seems plausible, targeting the next low. We should enter on confirmation, and place a stop-loss beyond the recent swing level.
❤️Sending you lots of Love and Hugs❤️

DOLLAR DOLLAR index is holding strong and US10Y doing the same .we keep eye on price movement and take action.


Continuation of DXY bullish narrative, who says NO?Like I said in my last published post, dxy is bullish for now till we see otherwise. The first TP has been reached, more than 100 pips bagged, the trade is still on but I'm looking at a possiblity of compounding here. I told you guys, this trade will make you a huge amount of money if you're willing to ride it with me.
This means bearish EURUSD AND GBPUSD et al. Trade accordingly. We may have a final sweep of 97.260 area. You can wait for that sweep before entering. I'm not, I won't be on chart then but the stop will hold. Few pips won't change the trade idea will it?
Follow me as my trades are usually market order, so you'll see them on time and enter on time.
Enjoy

Potential USD Strengthening Ahead | DXY vs BTCUSD Outlook
⚡ The DXY has now reached the lower boundary of its long-term ascending channel, a historically significant technical zone where rebounds have occurred in the past.
💡 If this pattern holds, a strong rebound towards the 121 level on the DXY looks probable in the coming months.
What does this mean for BTC?
Historically, a strengthening USD has often resulted in a reciprocal effect on BTCUSD, leading to downward pressure on Bitcoin prices. The chart suggests that if the DXY rebounds as expected, BTCUSD could witness a significant decline proportionate to the USD's strength.
Key Takeaways:
✅ DXY at crucial technical support – rebound likely.
✅ Target for DXY: 121 zone.
✅ BTCUSD may face downside pressure as USD strengthens.
✅ MACD showing early signs of bullish reversal potential for DXY.
Note: This is a technical analysis-based view. Always use risk management and combine multiple factors before trading decisions. For Educational purpose only.
💬 What are your thoughts? Will the USD rally put pressure on Bitcoin again? Share below!

DXY Weekly ForecastDXY Weekly Forecast
- look for down move when reaching 98.00 level
A Message To Traders:
I’ll be sharing high-quality trade setups for a period time. No bullshit, no fluff, no complicated nonsense — just real, actionable forecast the algorithm is executing. If you’re struggling with trading and desperate for better results, follow my posts closely.
Check out my previously posted setups and forecasts — you’ll be amazed by the high accuracy of the results.
DXY: Bears Are Winning! Short!
My dear friends,
Today we will analyse DXY together☺️
The recent price action suggests a shift in mid-term momentum. A break below the current local range around 96.860 will confirm the new direction downwards with the target being the next key level of 96.760.and a reconvened placement of a stop-loss beyond the range.
❤️Sending you lots of Love and Hugs❤️

Could the price reverse from here?The US Dollar Index (DXY) is rising towards the pivot, which has been identified as a pullback resistance that aligns with the 50% Fibonacci retracement and could drop to the 1st support.
Pivot: 97.90
1st Support: 96.74
1st Resistance: 98.67
Risk Warning:
Trading Forex and CFDs carries a high level of risk to your capital and you should only trade with money you can afford to lose. Trading Forex and CFDs may not be suitable for all investors, so please ensure that you fully understand the risks involved and seek independent advice if necessary.
Disclaimer:
The above opinions given constitute general market commentary, and do not constitute the opinion or advice of IC Markets or any form of personal or investment advice.
Any opinions, news, research, analyses, prices, other information, or links to third-party sites contained on this website are provided on an "as-is" basis, are intended only to be informative, is not an advice nor a recommendation, nor research, or a record of our trading prices, or an offer of, or solicitation for a transaction in any financial instrument and thus should not be treated as such. The information provided does not involve any specific investment objectives, financial situation and needs of any specific person who may receive it. Please be aware, that past performance is not a reliable indicator of future performance and/or results. Past Performance or Forward-looking scenarios based upon the reasonable beliefs of the third-party provider are not a guarantee of future performance. Actual results may differ materially from those anticipated in forward-looking or past performance statements. IC Markets makes no representation or warranty and assumes no liability as to the accuracy or completeness of the information provided, nor any loss arising from any investment based on a recommendation, forecast or any information supplied by any third-party.

FOLLOW THE TREND The DXY is showing signs of a momentum shift, transitioning into a bullish recoup as Q2 progresses. This shift may signal a change in broader market sentiment, with the dollar seeking strength amidst evolving macroeconomic conditions. Traders should watch for confirmation at key structural levels. follow for more insights , so you can make informed decisions ,comment for opinions , and boost idea

DXY IS BULLISH, SELL EURUSD, GBPUSD, WANNA BET?My last publish about dxy was stopped out but that doesn't invalidate the trade. We will still see a bullish dollar and bearish EURUSD AND GBPUSD.
SL @ 96.775
TP 1 @ 97.620
TP 2 @ 98.285
TP 3 @ 99.420
Use this trade to learn compounding and grow your account. Dont just take 10 pips and run off, once in profit,add more at a discount prices. The TP is certain
Enjoy
Follow me as my trades are market order, so you will see them on time and enter on time.

DXY HEAD & SHOULDER TARGET INSIGHT? The dollar index has printed a head & shoulder pattern on the hourly chart and while it's in resistance zone of initial target, there is momentum building up to push through to next target of 97.912. This is supported by a golden cross on the 1H timeframe. The target at 97.912 also closes a window that was left open on June 24th, 2025. This trade has a low risk to high reward ratio. Cheers and Best of trading to everyone

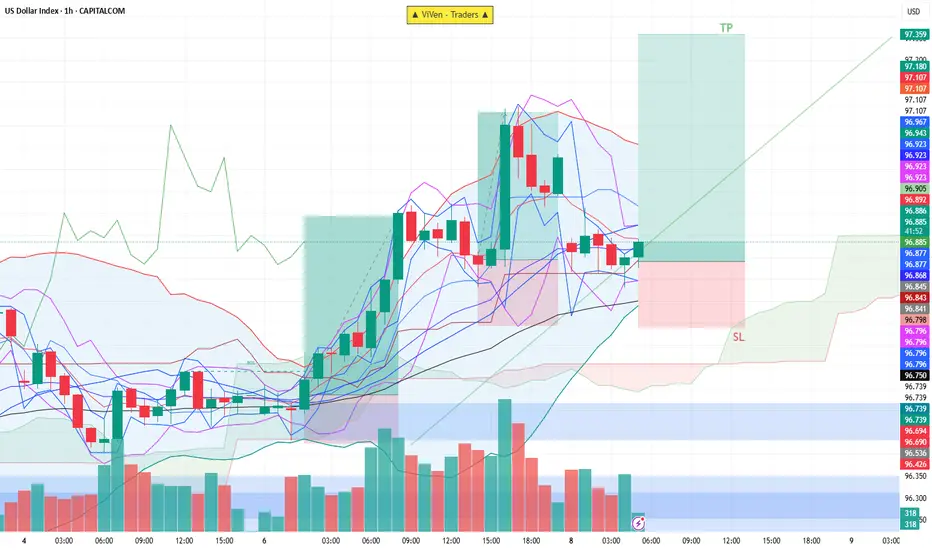
DXY Trade Setup✅ Trade Setup Details:
Entry: 96.850
Stop Loss (SL): 96.650
Take Profit (TP): 97.350
✅ This is a good RRR. A 2.5:1 ratio means you're risking $1 to potentially earn $2.50 — favorable for consistent trading.
📈 Chart & Technical Analysis (based on your image):
✅ Entry is near the middle Bollinger Band and above Ichimoku cloud — a technical support zone.
✅ SL is placed below recent support and Ichimoku base, giving some buffer in case of volatility.
✅ TP at 97.350 aligns with the recent swing high or top of the breakout channel.
⚠️ Things to Watch:
If DXY drops below 96.700, it may signal weakness or a shift in sentiment — watch volume and price reaction.
If price stays above cloud and rising trendline, your trade remains valid.
🟢 Summary:
Bias: Bullish
Setup: Good technical entry with solid support below and clear resistance target.
Risk-to-Reward: Excellent (2.5:1)
Strategy: Hold unless price breaks below 96.650 with volume.