DXYU.S Dollar Index
- Exp FIAT as an corrective pattern in short time frame
- Break of Structure
- RSI - Divergence
- Demand Zone
- Completed " 1234 " Impulsive Waves
USDINDEX trade ideas

DXY LONG/BUYBy utilizing Fibonacci retracement levels, historical patterns, , we can formulate a hypothesis that the market might follow a similar trajectory if bullish sentiment prevails.

Predict 3 Pairs!!!Using the Dollar Index, you can predict at least 3 different asset's direction of their price. EURUSD, AUDUSD, GBPUSD are pairs that oppose the direction of the DXY!

DXYDxy testing confluence zone, minor uptrend trendline + major downtrend trendline parallel + prior resistance
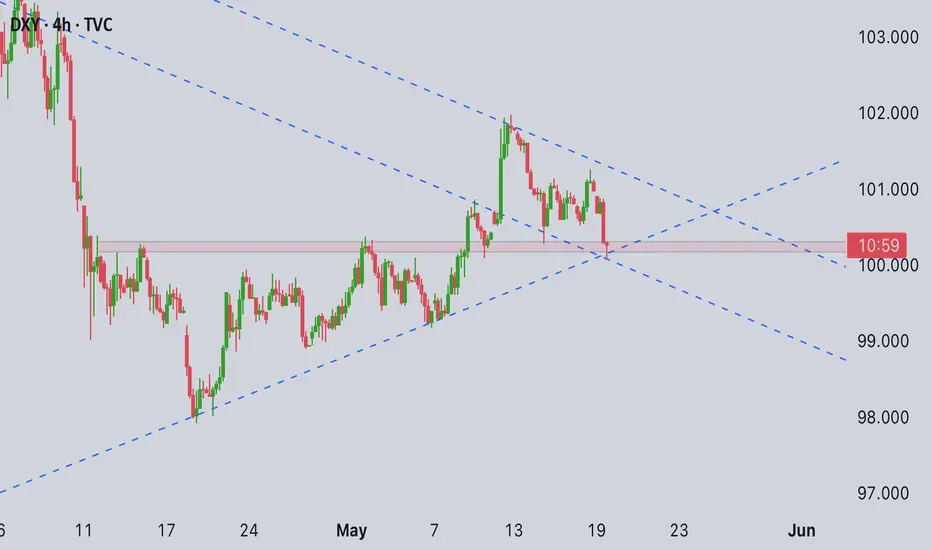
Chart spoke. We listened. See how price respected every level!"Great when BOS + supply/demand lines hit perfectly.
Most traders chased the bounce.
We waited in the shadows — right at the selling zone.
Wave 4? Textbook correction.
Wave 5? That’s where the money’s made.
Elliott Wave isn’t just theory — it’s a weapon.
Break of structure? Marked.
Zone tested? Clean.
Rejection? Savage.
This is how professionals trade — not with hope, but with precision.
DXY: playing checkers while we play chess.”**

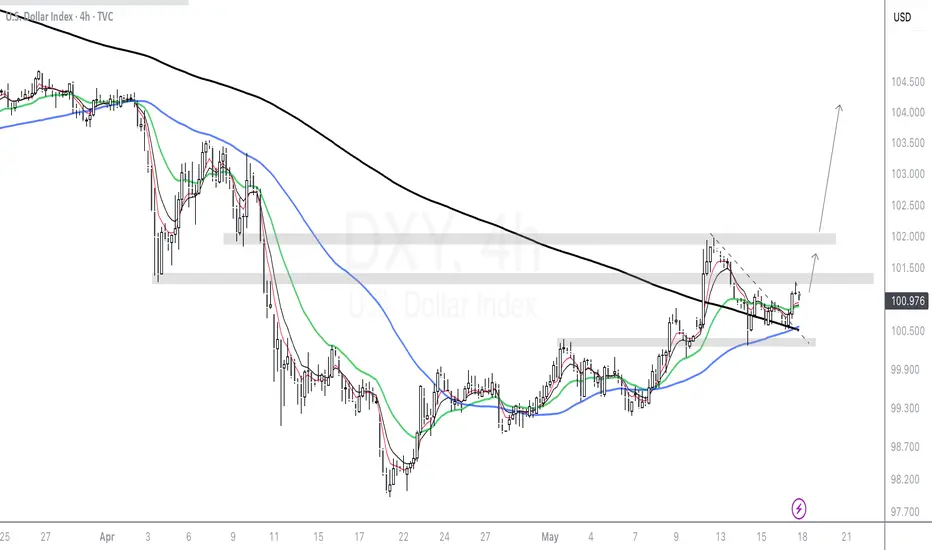
DXY Gaining strength (DXY - 18/05)Price has signalled that the bulls have paused selling. A strong breakout above resistance and triangle pattern break, we are watching for entries higher and looking for continued selling on commodities such as GOLD.
- Current price action on lower charts creating buying opportunities
- Watch 15min chart for next signal higher
- Monitor for continued strengh
USXUSD High Of The Month SetUSXUSD HOTM Set
Expansion lower expected with Previous Monthly Low as Draw on Liquidity.
OHLC Monthly Profile.

U.S. Dollar Index Set for Bearish Continuation The U.S. Dollar Index (DXY) has completed a five-wave impulse decline (labeled (1) through (5)) from the top of the descending channel. This downward move suggests a completed impulsive bearish leg. Following that, we’ve seen a complex corrective structure – a WXY double zigzag correction – now complete.
Price action shows a rejection from the upper trendline resistance near wave (2), confirming the bearish structure remains intact. The bounce into the corrective high (wave (2)) failed to break above key resistance, and we are now potentially entering a new impulsive move down labeled as wave (3) of the next larger degree impulse.
Primary Impulse Decline: Wave (1) to (5): Classic 5-wave move down ending late April.
Corrective Phase: Complex WXY correction (with subwaves A-B-C in both W and Y).
Current Wave in Play: Wave (3) of a larger impulsive sequence is initiating.
T1: 99.172
T2: 98.013
SL: 101.259
If price closes above 101.265 the current bearish impulse scenario would be invalidated.

US DOLLLAR INDEX - BY RICKO MMFXHumble greetings.
the above instrument is looking like a accumulating Bullish model, considering the recent fundamentals and catalysts behind the instrument I stalk longs in logical areas of the provided Weekly to Daily nearby structural ranges.
Should price in the 30 to 15 minute chart print out a Bullish Choch/Bullish playbook below the 4 hour internal low structure within the FVG and/or below for areas of origin I will be more confident going in for the kill.

The US Dollar – Under Selling Pressure Today💵 US Dollar Index (DXY) – Still Under Selling Pressure
📉 Current Zone: 100.29
The DXY continues its bearish momentum after failing to reclaim the technical resistance zone between 101.27 and 102.20.
🔍 Key Zone Analysis:
🔴 Technical Resistance Zone:
101.267 – 102.206 → Heavily rejected, confirming strong selling pressure.
🟢 Fundamental Support Zone:
99.447 – 99.939 → Key psychological level closely monitored by institutional players.
📊 Current Scenario:
🔻 As long as price stays below 101.26, the bearish bias remains intact.
📉 Downside target: retest of the 99.44 – 99.90 zone.
❌ Invalidation: clean break and close above 102.20.
⚠️ Events to Watch This Week:
Federal Reserve speeches
Key U.S. macro data (jobs, inflation)
The DXY remains vulnerable to any signs of rate easing or economic slowdown.
📘 Reminder: The information provided is for educational purposes only.
It does not constitute financial advice or an investment recommendation.
💬 Boost if you’re watching the DXY too! What’s your view on this support zone? 👇

DXY CorrectionMy vision where going price next week.
Question is does wave B finnish already or not.
Monday we will see about Wave B going higher or price move down to wave C.
TA show down but FA talk that dollar must rise.
Area 100.3 is trend zone
For my opinion bearish correction continue.

Check the trend The correction is expected to continue until the red support zone. Then there is a possibility of a trend change and the start of an uptrend. Otherwise, a continuation of the downtrend is likely.

Mindset Monday - Dealing With Big Losses “You can’t control if you lose — but you can control how much you lose.”
In this first episode of Mindset Mondays, we dive into the emotional and practical side of trading losses. I explore how risk management and mindset shape your long-term success, and why learning to accept and limit losses is one of the most powerful skills a trader can develop.
Whether you're dealing with a tough loss or want to build mental resilience before the next one hits, this video is for you.
🎥 Watch now and take control of what is in your control.

Bullish bounce?US Dollar Index (DXY) is falling towards the pivot and could bouce to the 1st resistance.
Pivot: 100.17
1st Support: 97.91
1st Resistance: 101.93
Risk Warning:
Trading Forex and CFDs carries a high level of risk to your capital and you should only trade with money you can afford to lose. Trading Forex and CFDs may not be suitable for all investors, so please ensure that you fully understand the risks involved and seek independent advice if necessary.
Disclaimer:
The above opinions given constitute general market commentary, and do not constitute the opinion or advice of IC Markets or any form of personal or investment advice.
Any opinions, news, research, analyses, prices, other information, or links to third-party sites contained on this website are provided on an "as-is" basis, are intended only to be informative, is not an advice nor a recommendation, nor research, or a record of our trading prices, or an offer of, or solicitation for a transaction in any financial instrument and thus should not be treated as such. The information provided does not involve any specific investment objectives, financial situation and needs of any specific person who may receive it. Please be aware, that past performance is not a reliable indicator of future performance and/or results. Past Performance or Forward-looking scenarios based upon the reasonable beliefs of the third-party provider are not a guarantee of future performance. Actual results may differ materially from those anticipated in forward-looking or past performance statements. IC Markets makes no representation or warranty and assumes no liability as to the accuracy or completeness of the information provided, nor any loss arising from any investment based on a recommendation, forecast or any information supplied by any third-party.

Sunday Viper Weekly breakdown May18Sunday's we break down the market going over upcoming news and take a forward look at developing chart patterns and strategy build ups

BTC's Last Shot at reversal?With the DXY in the overbought range on the RSI it looks like bitcoin could bounce, but is that it? Looking very bearish, but something in my gut says it could boom soon... Just a simple guess!

Retrace to 98ish before liftoffExpecting a retrace to the 98 range before a pump to the 118ish range

DXY 1H Outlook: Bullish Bias for the Week AheadThe DXY 1-hour chart is showcasing a bullish trend as we approach the upcoming week. Traders should monitor the 1-hour chart for potential entry points that align with this bullish trend. As always, it's crucial to manage risk appropriately and stay informed about any economic events that could impact the dollar's performance.


May 19–23, 2025GOLD (XAU/USD)
🔑 Key levels:
Resistance: $3,250 – $3,280
Strong Support: $3,150 – $3,120 | $3,050 (a breakdown could push lower)
🗓️ Important News:
FOMC Minutes (Wednesday, May 21) – market will react to tone regarding inflation and rate policy.
US Manufacturing & Services PMI (Thursday, May 22)
🎯 Strategy:
If gold dips to the $3,120–$3,150 zone, consider short-term buying, targeting a move back to $3,250.
A break below $3,100 may signal a sell opportunity, targeting $3,050 or lower.
A breakout above $3,280 → consider buying the breakout. Avoid trading in the chop zone ($3,200–$3,250) unless clear momentum.
💵 USD Index (DXY)
🔑 Key levels:
Resistance: 104.50 – 105.00
Key Support: 103.20 – 102.80
🗓️ Important News:
FOMC Minutes (high impact)
U.S. Housing data, PMI, Durable Goods Orders
🎯 Strategy:
DXY is showing weakness. A break below 103.20 would suggest further USD weakness → bullish for gold and EUR/USD.
If DXY bounces from 103.20 → short-term recovery likely → possible correction in risk assets.
EUR/USD setup: consider buying on a breakout above 1.1000 targeting 1.1200.
📈 U.S. Stock Indices (S&P 500, NASDAQ)
🔑 Key Levels (S&P 500):
Resistance: 5,300 – 5,350 (near all-time highs)
Support: 5,200 – 5,150
🗓️ Important News:
FOMC Minutes – could cause major volatility
Possible speech from Fed Chair Powell
ETF flows and any remaining earnings reports
🎯 Strategy:
If S&P holds above 5,200 → maintain buy on dips strategy.
A break below 5,150 → opens risk for a deeper pullback toward 5,000.
Maintain long positions as long as markets price in rate cuts in Q3.
✅ Weekly Strategy Summary:
Market Primary Strategy Key Levels to Watch
Gold Buy around $3,120–$3,150 Support $3,120 – Resistance $3,280
USD (DXY) Sell if it breaks below 103.20 Support 103.20 – Resistance 104.50
S&P 500 Buy on dips above 5,200 Support 5,150 – Resistance 5,300–5,350

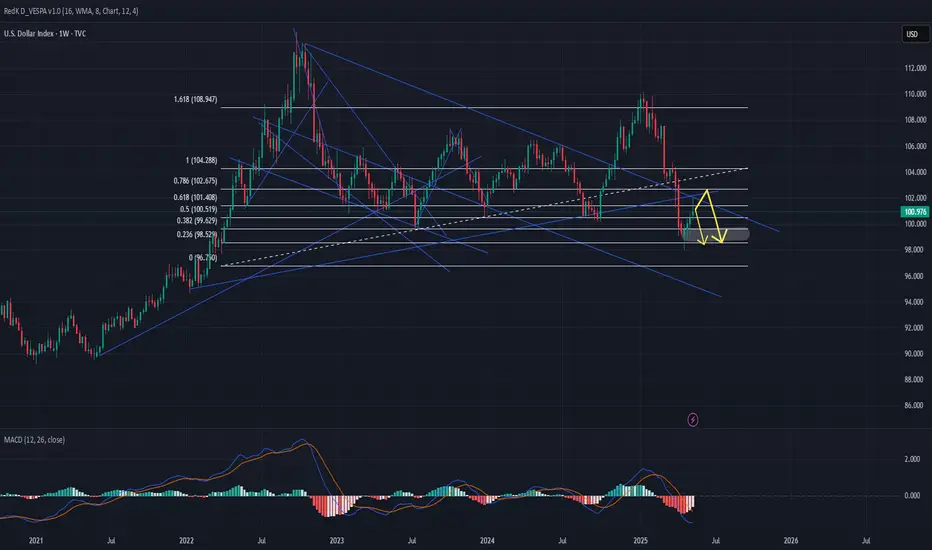
DXY - Dollar Index AnalysisThe U.S. Dollar Index (DXY) remains in a bearish zone, as indicated by the current weekly chart. There is potential for further downside movement toward the 99.70 level, which serves as a strong support area. If this level is breached, the next key support could be found near 98.56.
Alternatively, the index may experience a short-term correction to the upside. A breakout above 101.40 could trigger a move toward the 102.40 resistance level. However, this upward movement is likely to be limited, and the broader trend suggests a probable return to bearish momentum, potentially driving the index back down toward 98.56.
DXY weekly outlookWeekly analysis for DXY: the broader bias remains bullish. I expect price to respect the stacked 3‑hour demand zones, with the lower zone likely providing the stronger reaction.
After that bounce, a short‑term bearish pullback could unfold from the 4‑hour supply zone. Although I don’t trade the dollar directly, I track DXY for its correlations with other pairs to add confluence and strengthen my setups.

DXY (Timeframe synchronization + BOS + Orfer Flow + Supply)Hello Traders!
Our previous supply was mitigated, now we have confirmation + supply zone, there we can expect reversal on LTF.
Have a profitable day and don't forget to subscribe for updates!
