TIA bullishBINANCE:TIAUSDT
We’re seeing Celestia respecting the support btw $4.2 and $3.8 after being in a downtrend. Right now its trying to break the Key Lvl which has played as support and resistance.
So far, it hasn’t broken through, If a daily candle breaks this level and closes above it It means a reversal and the targets will be ld $12 and then $15
TIAUSDT trade ideas

$TIA - Buying ZonePrice Action Overview:
TIA (Celestia) surged by 80% following its major token unlock last October. It broke out from a 150-day accumulation range.
Current Situation:
The price is currently facing rejection at the yearly VWAP. While there’s potential for a spike to $9.50–$10 range, a breakout from this channel is unlikely in the immediate term.
Potential Pullback:
A retest around $6.70 (previous range high) is expected. There’s also a possibility of deviation down to $5.50
Accumulation Zone:
If you’re looking to accumulate, the $6.70–$5.50 range is an ideal area to consider.

tia usdtWe have a good probability to see above the price to 12 at this week, i guided by just technical analysis.

TIAUSDT CelestiaThis chart is just for fun. I bought big bag of TIA (4.55 avg) just in case. If my idea is correct, it could go more then 1000% up Do your research...

TIA Long Spot Trade (Reversal Potential) Market Context:
TIA has faced a significant downturn due to distribution, but it appears to have bottomed after breaking out of its trend line resistance. The price has reclaimed its bear market range and is consolidating above support, signaling potential for a strong rebound.
Trade Setup:
Entry Zone: Around $7.40 (support level)
Take Profit Targets:
First target: $8.50
Second target: $9.85
Stop Loss: Just below $6.70
This setup leverages the breakout confirmation and support retest for a calculated risk-to-reward opportunity. Monitor for sustained price action above the breakout level.

#TIA/USDT#TIA
The price is moving in a descending channel on the 4-hour frame and it was broken upwards
We have a trend to stabilize above the moving average 100
We have an upward trend on the RSI indicator that supports the rise by breaking it upwards
We have a major support area in green at a price of 4.50
Entry price 5.40
First target 6.33
Second target 6.60
Third target 7.60

TIA Swing Long Idea - Celestia Altcoin LongTIA was one of the best-performing assets during the 2023-2024 altcoin run. As a leader in modular blockchain technology, I find its fundamentals very strong. I’ve been holding a significant number of TIA spot positions since 2023."
Technical Analysis:
The price has been relatively weak over the past few months. However, starting from September 2024, we saw an upward movement, creating a weekly bullish structure. The price broke the bearish trendline and closed above it. After deviating from the trendline, it retraced to the daily demand zone below, found support, and is currently holding above the trendline.
The price appears to be in an accumulation phase, lagging behind the upward movement of other coins. Despite this, I like the current levels and have opened a small position here.
Note: If Bitcoin retraces sharply, it could trigger the stop loss and take me out of the trade. To manage this risk, I will monitor the daily close below my stop-loss level before fully exiting.
SL: $3.60
TP1: $7.60
TP2: $11.90
TP3: $15.55

TIA to 100$🚀 TIA 🚀
close to breakout
$59 post-breakout target at Fib 1.618
before unlocking 175.75 millions LSE:TIA tokens
Expecting retracement to Fib 0.382 with a buyback,
then aiming for $90-$110 before selling unlocked supply
like + follow + repost = appreciation
#NFA
#DYOR

TIAUSDT Long term trade IdeaTIAUSDT is in accumulation zone since long time and expects a breakout at the mentioned point, possible target and SL are highlighted.

TIA IS ON OF TheM ( ALTSEASON ALERT )hello everyone
wish you best
Tia can make some targets as I drow in chart
you can enter now or wait for pull back and last confirmation
I WILL go riGHt now for next ALTSEASON from this coin

Consolidation and Recovery phase for TIA/USDTBINANCE:TIAUSDT has entered Consolidation and Recovery (C&R) phase.
which should last upper till it reaches previous ATH, if cross it, then it will enter new BULL run phase.
P.S.: When you get rich with my analysis, don't forget to thank me to my wallet, I will appriciate it.
P.S.S.: DYOR.

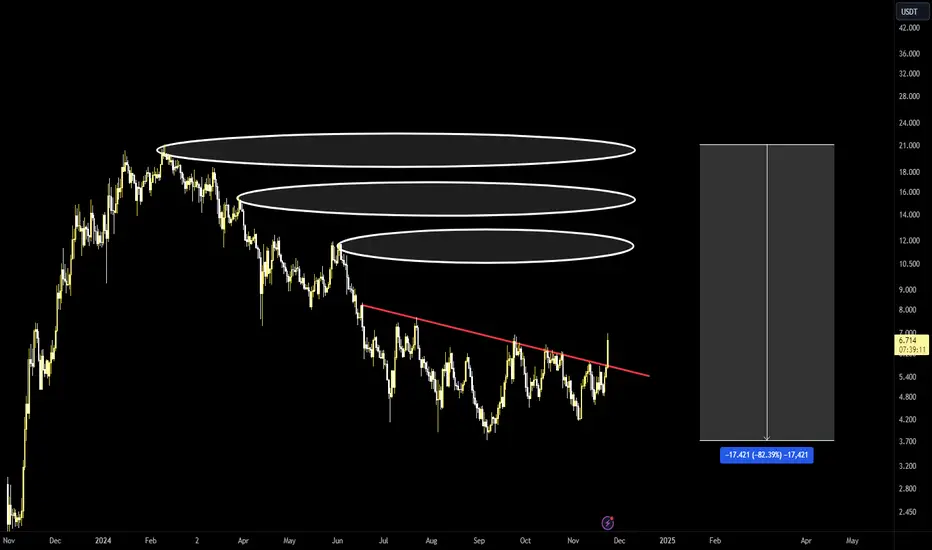
TIA´s monster short squeeze setup- TIA is an unique coin in the sense that it was a heavy overperformer in the latter part of Q4 last year but has since then known nothing but downside
- with 82% from its ATH it is safe to say TIA´s bottom is in however due to the nature of the correction there is reason to believe that the upwards move from this bottoming base will be extremely violent, near vertical
- 5D RSI is incredibly constructive with a clear inverse head and shoulders formation alongside 5D stoch momentum turning up
TIAUSDT Breaks Resistance: Strong Bullish Move AheadTIAUSDT Technical analysis update
TIAUSDT has been consolidating for the past 160 days, repeatedly testing the trend resistance line. Today, the price broke above the resistance line on the daily chart and crossed above the 100 EMA. A strong bullish move is anticipated in the coming days.
Buy zone : Below $6.30
Stop loss : $5.32
Take Profit 1: $7.10
Take Profit 2: $8.50
Take Profit 3: $11.85

TIATIA / USDT
After long correction period and another 5 months accumulation many people lost confidence in TIA but it finally brokeout
Its flying above our entry by 24% but looking at chart its just brokeout and long Journey still ahead
Best of wishes

TIA/USDT 4H Celestia is a project that has a lot of potential this Bullrun, we saw an early surge in the beginning of the year once the project was released nearly one year ago. A modular blockchain network, first of its kind is an exciting new technology and we've seen how well new projects do during their first Bullrun often outperforming their older rivals.
I would like to see the bullish pennant formation playing out now. The bearish downtrend breakout caused by a republican victory results in a breakout & retest of the BULLISH OB as new support. Now a bullish pennant has formed midway up the mini range, normally this is a continuation pattern and with the bullish narrative in play I think it's probable we see this pattern play out fully with the resulting rally hitting resistance around the $6 mark (BEARISH OB).
IF deciding to take the trade once the parameters are met a conservative 2.25R trade is in play , once the first TP is hit the larger SL can be moved to Break Even . I do believe that TIA continues to move beyond the $6 mark however there is a lot of resistance there for now. A separate trade outlook will be needed to tackle that area.

TIA USDTToo great to be ignored. This time sorry the chart is a bit messy, but there are more than one POV that could give you the conviction why the only way is up from now on.
The red lines indicates a complex Inverse Head and Shoulder pattern featuring many retests on the shoulder part and even false breakout happened in the process.
The white lines could be seen as again another Inverse Head and Shoulders.
Finally, it can also be seen as a triangle breaking out from the range. The ideal range is to bid is at the blue box if the trend allow us to do so. Consider start your entry multiple times along the trend to have optimal average.
Based on the flow in the market, you can see all its peers has gained crazy momentum of more than 20% recently. Do you think TIA will fall behind or following the footsteps. Let's share the ideas in the comments. Appreciate it.

TIA is at the bottom of the channel!The TIA is at the bottom of the major channel, it has broken the minor channel and is the bottom of the major channel.
We also have a bullish iCH on the chart, which gives us a bullish view.
A trigger line has also been created on the chart, which will break soon.
The mid-term and long-term targets are clear on the chart.
Supply range is very important for us
Closing a daily candle below the invalidation level will violate this analysis
invalidation level: 4.08
Do not enter the position without capital management and stop setting
Comment if you have any questions
thank you

TIA / USDT: gearing up for breakout TIA/USDT: Gearing Up for a Breakout Above Trendline Resistance
TIA/USDT is positioning itself for an exciting move 📈 as it nears a critical trendline resistance zone 📊. The price action has been consolidating within a tight range, creating an ideal setup for a potential breakout 💥. A confirmed breakout could pave the way for a strong bullish rally 🚀. Stay vigilant and wait for clear confirmation before making a move.
Key Insights:
1. Trendline Resistance: TIA/USDT is testing a long-standing trendline that has consistently acted as a barrier. A decisive break above this resistance could initiate a strong upward trend.
2. Volume Surge: Keep an eye on trading volume during the breakout. A significant increase will validate buyer strength 🔥.
3. Bullish Indicators: Momentum indicators like RSI and MACD are trending positively ⚡, signaling a favorable environment for a breakout.
Steps to Confirm the Breakout:
Look for a clear 4H or daily candle close above the trendline 📍.
Watch for a noticeable spike in volume to confirm strong buying activity 📊.
A retest of the broken resistance as new support will solidify the breakout ✅.
Stay cautious of fake breakouts, such as sharp reversals or wicks above the trendline ⚠️.
Risk Management Strategies:
Set stop-loss orders below key support zones to limit potential losses 🔒.
Ensure your position size aligns with your overall trading strategy and risk tolerance 🎯.
This analysis is for educational purposes only and not financial advice. Always conduct your own research (DYOR) 🔍 before making any investment decisions.

$TIA bullrun perspectiveBINANCE:TIAUSDT dea, sweet 4x to ATH on spot,
can leverage this and get possible 10x returns
personally im waiting for $4.5 or below to long this


Tia/Usdt Looks Promising TIA/USDT is currently consolidating near a key resistance level, showing signs of potential upward momentum. The price has been moving within a tight range, indicating that a breakout could be on the horizon. Traders should monitor this pair closely for confirmation signals as the next move could be significant.
Key resistance and support levels to watch:
- Resistance:
- Support:
To approach this trade effectively:
1. Wait for a clear 4-hour or daily candle to close above the resistance level, signaling a potential breakout.
2. Look for a noticeable increase in trading volume during the move, as this often validates the strength of the breakout.
3. Be cautious of fake breakouts, which can occur if price reverses sharply after a temporary move above resistance.
Risk management is essential in this scenario. Set stop-loss levels below recent support zones to protect against unexpected reversals. For those already in the trade, this is a good time to review your strategy and adjust accordingly.
As always, this analysis is for informational purposes only. Conduct your own research before making any trading decisions.

TIA - 800%TIA has been oscillating between $4 and $7. It has made a nice chart. I like it. I see it with great potential, even 700% TP3 is not unrealistic. For some time now, increasing volumes have been coming in.

Long On TIA Head and shoulder pattern strongest breakout
accumulation zone
5X easily possible
technically strong coin
