Showing Weakness Tia coin's price action and RSI is showing weakness on the chart. High chances it might go to the $15 range if it cannot close above $19.8 to $20 on the hourly candle. It is also throwing spinning top candles which are bearish. Be careful of a liquidity grab spinning top candle to intend to to trigger your stop loss before dumping.
Let's see how this plays out.
Not a financial advice.
TIAUSDT trade ideas

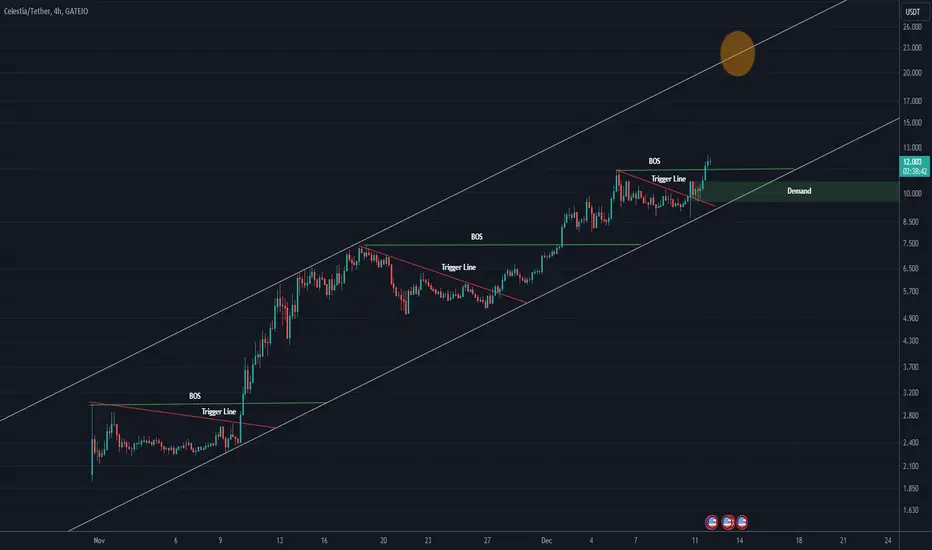
TIA ANALYSIS (4H)The TIA symbol is moving well fractally. This symbol is moving in an ascending channel.
Every time it breaks the Trigger Line and BOS the previous ceiling, A good bullish wave is formed. By maintaining DEMAND, the zone can even reach the yellow circle
CELESTIA"CELESTIA SUPPORT and RESISTANCE!!!
It will slowly first before moving upwards.
Let's see!!"

TIA Key Levels on Bearish & Bullish Outlook
Current Status: Bearish Divergence formation until invalidated
Z-Score Probability Indicator
Expect Upper $23+ level on
Expected Mean return level: $9

TIAusdtMy analysis is simple, considering that the price has reached the top of the channel, I expect a correction to the bottom of the channel.
This is only analysis, do not base it on buying or selling.

TIAUSDTBINANCE:TIAUSDT Short idea
2 entry point
3 targets
❌every TP can act as a support and pump the price
⛔"Daily crypto market analyses I provide are personal opinions & not financial advice. Trading carries risks, so do your own research & seek advisor's help. #DYOR
Don't forget to 🚀 and comment

TIA BUY SETUPTIA has an ascending structure.
In the lower areas, Ndingya pools are formed. It is expected to start another upward movement by collecting these pools
We are looking for buy/long positions on the green range. Closing 1 daily candle below the green range will violate the analysis The targets are clear on the chart
For risk management, please don't forget stop loss and capital management
When we reach the first target, save some profit and then change the stop to entry
Comment if you have any questions
Thank You

Bearish SharkIt seems like the bearish shark harmonic pattern! Idea was created for education & entertainment and this is not a trading advice

When is TIA pulling back?TIA had a successful breakthrough and now according to the Fibonacci levels and data on liquidity levels the potential pullback to the breakout seems to be sitting at 20s. Trade with caution!

TIA celestia x15 project potential 2025TIA celestia x15 project potential 2025
support and takek profit levels
fibonacci extention
dyor

$TIA ON STEROIDIf you didn't get in on this below $10..trade carefully with the current hype.
Yes. Staking this golden asset can qualify you for many future airdrop. Carefully weigh your choices if you have to buy at the current top or wait for the pull back.
I will be patient and filling in and staking1TIA at a time..

#TIA/USDT #TIA
The price is moving sideways in the channel. We are now in the middle of the channel
There is a possibility of a rebound from that area upwards
Or retest the support area at 12.00
Entry can be divided into two times
Current price 13.25
First target 14.00
Second goal 14.92
Third HDQ 16.43

TIA/USDT Ready for 30$ 🚀 TIA/USDT shows incredible strength and a rise is imminent, as the price gears up for a major takeoff! Hold on tight, it's just a matter of time. My target remains unchanged at 30$. Buckle up and let's see this rocket soar! Remember, this is not financial advice. DYOR (Do Your Own Research)!
Remember to always do your own research ,Trading involves risks, and this idea should be approached with caution. Good luck!

TIA Technical Analysis• As observed, there has been a recent development on the 4-hour TIA chart, indicating the formation of a triangle.
• In the last few candles, a breakout has occurred through the triangle's upper boundary.
• It is important to note, however, that the consolidating candles are not yet formed.
• Therefore, it is reasonable to expect a pullback in this vicinity.
• Following the pullback, a continuation of the upward price movement is anticipated.
(All analyses will be updated)
This analysis is informational, not financial advice.

TiaUsdt shorttarget =17.25
Considering the withdrawal of the whales of this currency, it is illogical to buy at these prices.

TIAUSDT SHORTSHORT POSITION
Signal Validity: 1h
Order Price: market ( 18-18.3)
TP: 16.8
SL: 19.29
Margin: 2% of the capital
Risk/Reward Ratio: 1.4
CROSS 3X-5X
Pay attention to the validity time of the signal from the time of publication. After the end of credit, if the order is not activated, delete the order.
See the results on the channel.

TIAUSDTmy entry on this trade idea is taken from a point of interest below an inducement.. I extended my stoploss area to cover for the whole swing as price can target the liquidity there before going as i anticipate.. just a trade idea, not financial advise

TIA DCA inhere's my plan for TIA
I'll update when I'll have more price info
but for now that's how I'm seeing it
educational purpose only

Celestia TIA Coin Price Prediction🔥 Price on the 4H chart might come at these support area and we might get a potential bounce🔥
Potential bounce areas for Buying 16.7888 and 15.4400
👉 Follow me for More Real Time Opportunities.
Share your Thoughts if you have any?

Mock Up Price Action for TIA | Mid Term (12HR)Mock Up Price Action for BINANCE:TIAUSDT | Mid Term (12HR)
- Watching and waiting for opportunities to enter short
Personal Approach & Base Chart Setup
- Stacked Parallel Channels for Grid of Confluence Points
- High Time Frame (HTF) Fib Extensions, Retracements, & Time Cycles
- Red Filled Horizontal Rectangles between areas of major Fib level from Extensions and Retracements
- Price Label Callout with Red Circle highlighting points of interest where I'd consider making a trade
- I will consistently monitor and adjust taking into consideration long/mid/near term price action and market conditions/news

TIAUSDT LONG POSITIONLONG position
Signal validity: 2D
Order Price: 12.86
TP: 16.17
SL: 10.83
CROSS 3X
Margin: 2% Capital
Risk/Reward Ratio: 2.17

LONG SIGNAL CRYPTO MARKETThe fourth tip sounds simple: protect your capital. What do you mean with that? Even successful day traders experience phases in which several trades in a row do not work. Then not acting emotionally is the art. Anyone who acts emotionally and absolutely wants to make up for losses no matter what, risks unnecessary losses. However, if you stick to your strategy and act prudently, you will climb out of this valley and complete successful trades.

TIA Break out a consolidation channel!TIA is on a stable up trend and start to consolidate giving the possibility to the price to rise.
The coin has broke the 15$ resistance level and now is confirming his choice to rise.
the first possible potential target is 22.5 and from there we will see how to move on.
good trading
