How Long TIA Will Silent?Structurally it still looks declining, but there is something quite promising about the structure.
The scenario I expected to happen. It looks like there will still be a lot of drama as long as it doesn't break away from dynamic resistance, especially the yellow dot.
Let's just wait for confirmati
Related pairs

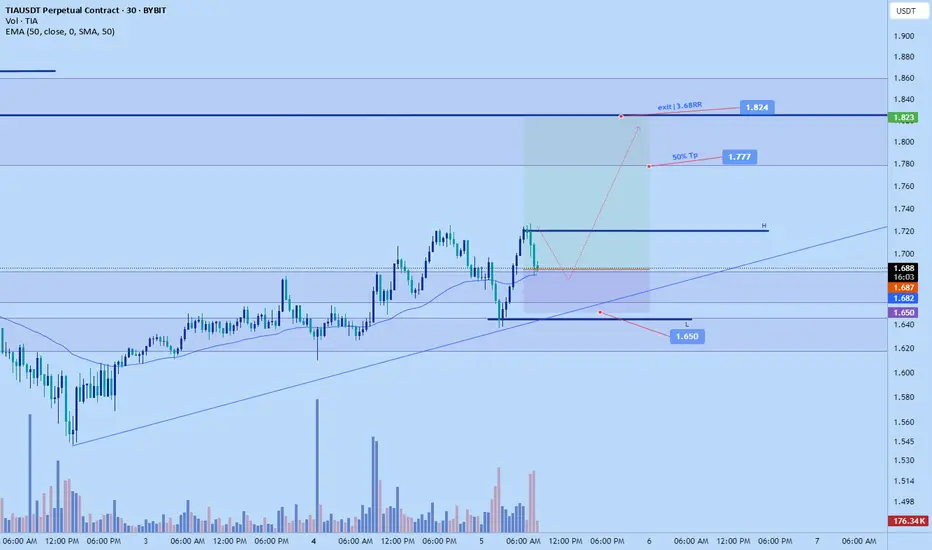
Tia pump to $1.824Just recently opened a long position on Tia.
Aiming for 1.824 target today. scaling out
Sl: 1.706 todays, daily wick low
Tps on chart
Might correct a bit for better entry if just seeing this

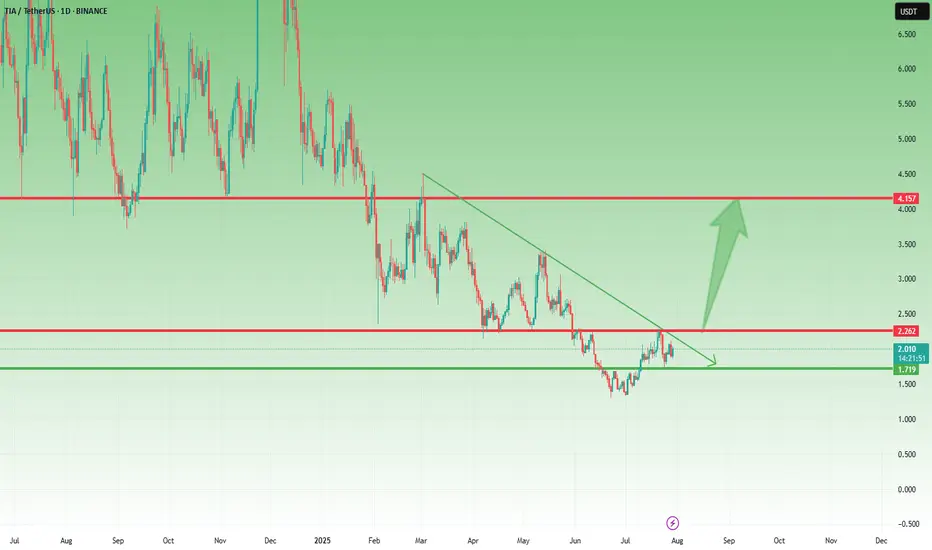
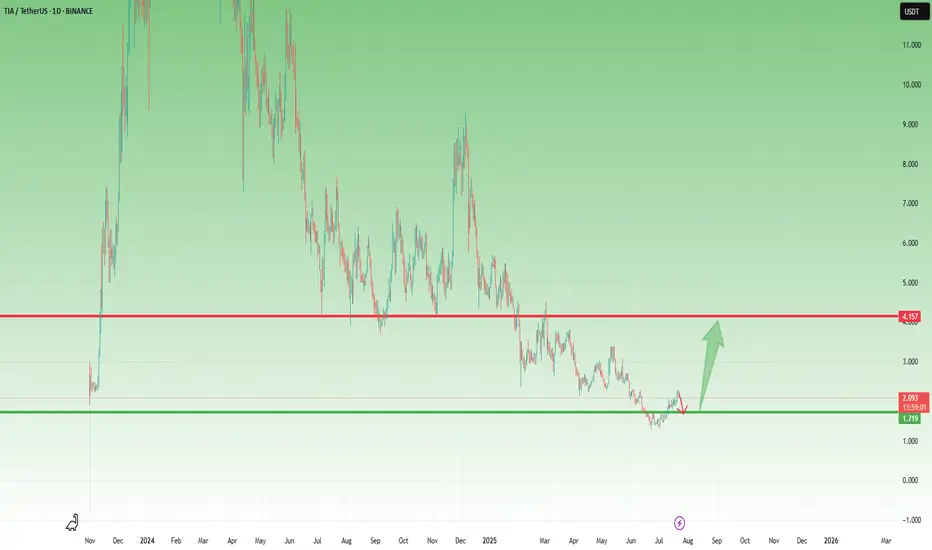
TIA Holding Support – Break Above $2.20 Could Trigger Big MoveLast week, I mentioned that TIA could be preparing for a move and that buying dips around $1.75 might be a good opportunity.
Well, price dropped exactly into that support zone, bounced slightly, and is now consolidating, which could be the calm before the next wave.
_________________________________
Will #TIA Continue to Soar or Bears Can Halt it? Must Watch Yello, Paradisers! Will we see #TIA continue to soar from here, or can bears halt its momentum? Let's see the latest setup of #Celestia to see what's going to happen:
💎Following a textbook ascending channel structure, #TIAUSDT has been respecting both its ascending resistance and ascending support,
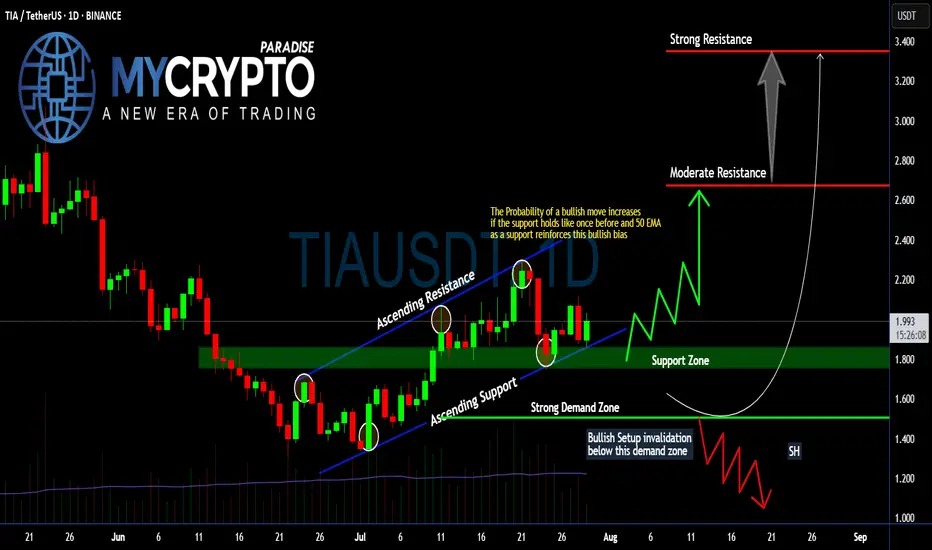
Celestia · A Strong Bullish Wave of GrowthCelestia right now looks pretty good. This one was called to my attention by one of my followers in the comments. The truth is that we've been looking at TIAUSDT and right now it continues to look good. The candles message is that the action is about to transform into a very strong advance. The acti

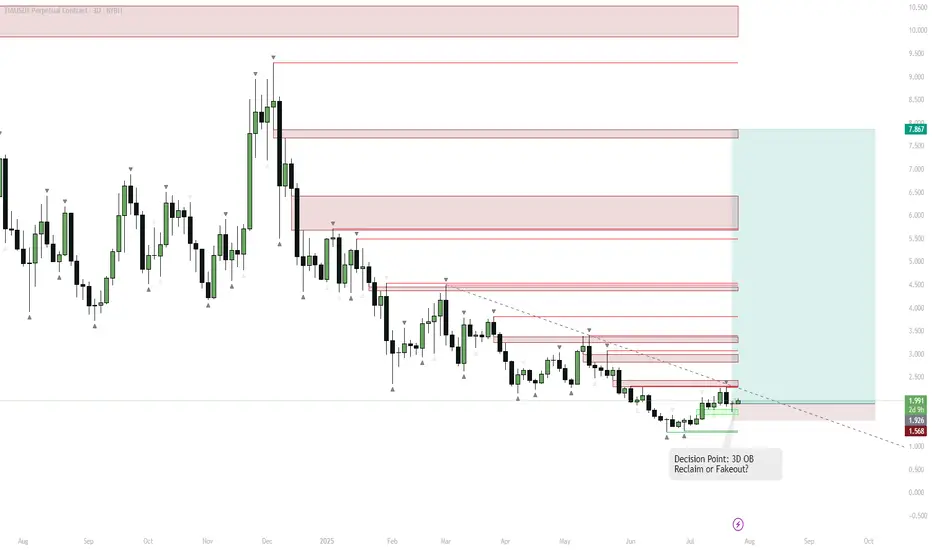
TIA — Pivot Point: 3D Order Block Reclaim or One More Breakdown?Key Observation
LSE:TIA has been in a prolonged downtrend, with a recent strong bounce from multi-month support (highlighted green).
Multiple supply zones (red) are stacked above, representing resistance.
Swing Short Context
Despite the bounce, the asset has a history of fakeouts and failed br
Celestia (TIA): Market Structure Break | Good Buying OpportunityTIA formed a decent MSB, which marked a switch in trend. We are looking for further movement to upper zones from here, which would give us good R:R ratio trading setups so let's see.
Swallow Academy

TIA- Is the Coin Finally Ready to Wake Up?After its launch on Binance in November 2023 and the immediate 10x pump, BINANCE:TIAUSDT has been, to put it mildly, a constant disappointment.
Since then, the hype has faded, and the price slowly deflated — leaving holders frustrated and the chart uninspiring.
🔍 Recent Signs of Life
However
TIA Trying Catch Falling Knifeafter downtrend continuation from early December 2024, i think we will meet target around 1.2 with several factor
if we can hold this line maybe we will have small pullback for retest resistance

See all ideas
Summarizing what the indicators are suggesting.
Oscillators
Neutral
SellBuy
Strong sellStrong buy
Strong sellSellNeutralBuyStrong buy
Oscillators
Neutral
SellBuy
Strong sellStrong buy
Strong sellSellNeutralBuyStrong buy
Summary
Neutral
SellBuy
Strong sellStrong buy
Strong sellSellNeutralBuyStrong buy
Summary
Neutral
SellBuy
Strong sellStrong buy
Strong sellSellNeutralBuyStrong buy
Summary
Neutral
SellBuy
Strong sellStrong buy
Strong sellSellNeutralBuyStrong buy
Moving Averages
Neutral
SellBuy
Strong sellStrong buy
Strong sellSellNeutralBuyStrong buy
Moving Averages
Neutral
SellBuy
Strong sellStrong buy
Strong sellSellNeutralBuyStrong buy
Displays a symbol's price movements over previous years to identify recurring trends.
Frequently Asked Questions
The current price of TIA / UST (TIA) is 1.83940000 USDT — it has fallen −3.43% in the past 24 hours. Try placing this info into the context by checking out what coins are also gaining and losing at the moment and seeing TIA price chart.
TIA / UST price has risen by 10.76% over the last week, its month performance shows a −3.56% decrease, and as for the last year, TIA / UST has decreased by −68.66%. See more dynamics on TIA price chart.
Keep track of coins' changes with our Crypto Coins Heatmap.
Keep track of coins' changes with our Crypto Coins Heatmap.
TIA / UST (TIA) reached its highest price on Aug 11, 2024 — it amounted to 7,777.00000000 USDT. Find more insights on the TIA price chart.
See the list of crypto gainers and choose what best fits your strategy.
See the list of crypto gainers and choose what best fits your strategy.
TIA / UST (TIA) reached the lowest price of 0.10000000 USDT on Nov 26, 2024. View more TIA / UST dynamics on the price chart.
See the list of crypto losers to find unexpected opportunities.
See the list of crypto losers to find unexpected opportunities.
The safest choice when buying TIA is to go to a well-known crypto exchange. Some of the popular names are Binance, Coinbase, Kraken. But you'll have to find a reliable broker and create an account first. You can trade TIA right from TradingView charts — just choose a broker and connect to your account.
Crypto markets are famous for their volatility, so one should study all the available stats before adding crypto assets to their portfolio. Very often it's technical analysis that comes in handy. We prepared technical ratings for TIA / UST (TIA): today its technical analysis shows the neutral signal, and according to the 1 week rating TIA shows the sell signal. And you'd better dig deeper and study 1 month rating too — it's sell. Find inspiration in TIA / UST trading ideas and keep track of what's moving crypto markets with our crypto news feed.
TIA / UST (TIA) is just as reliable as any other crypto asset — this corner of the world market is highly volatile. Today, for instance, TIA / UST is estimated as 3.73% volatile. The only thing it means is that you must prepare and examine all available information before making a decision. And if you're not sure about TIA / UST, you can find more inspiration in our curated watchlists.
You can discuss TIA / UST (TIA) with other users in our public chats, Minds or in the comments to Ideas.