TIA BULLISH MOVE AHEADTIA is currently trading above upper band of symmetrical triangle, another bullish wave is expected.
TIAUST trade ideas

Celestia - to the sky ?Celestia has the potential to grow into a top15/20 mcap project
Taking this into account + the technical analysis with a retest of RSI50 on the 3D TF, that gives us a swing idea with the idea of a possible acceleration on Total 3
Final tp would be just under 100usd - with intermediate at the fib ext levels

TIA inteligentassetBullish scenario
Resistances 15.5 in 50 ema, 18,19.1,
21, 23 upper limit channel
Bearish scenario
Supports 14, 13.1 pivot low, 12 lower limit channel

TIAUSDTsweeps are long entries from here
market grind down looks nearly over
shorts have been piling up on btc too apparently
not wise given 1.2T spending approved which is exeedingly risk on for all alts to USD
spending continues
inflation hedges grind higher..
bid for eth and btc mean more alternative alts probably grind up from here also...
this gem L1 has hardly dipped since its inception i doubt it lasts too long..

TIA expectation Since the volume of TIA has been rising and the good trend break-out about to happen why not?

TIA reversalPer a request, TIA is showing a strong reversal here after building support on a fib extension. This price level from Dec 2023 clearly poises a strong resistive area above it. I foresee a strong push to 16$ very soon. There is a lot of selling around 16.7$ though and this area presents a challenge. I bet a lot of this is token unlocks and staking. Sadly only 16% of the total supply is released. A perfect exit for insiders /early investors during a bull market. It is very easy to dump tokens on retail during these bullish trends. This is largely why I have avoided TIA.
-I do not see this as a top performer this cycle, although I would love to be proven wrong, I am partial to cosmos tokens.
-Short-term bullish
-Medium term I think the token struggles as early investors continue to dump tokens

TIA/USDT It required break to switch back to be Bullish for TIA!💎 TIA has recently exhibited significant market dynamics. Currently, TIA is encountering resistance, necessitating a break and reclamation of price above this level to probability trigger a bullish reversal and continue the upward movement towards our target area.
💎 However, if TIA fails to overcome the resistance and experiences rejection, there's a likelihood of a retracement to test the support area within the range of $11.5 to $10.5.
💎 When TIA reaches the support area, it's crucial for it to bounce as this zone holds considerable significance. Failure to sustain this support level could result in further downward movement for the price.

TIAUSDT longflat+diviation + round 'bottom', mbos... Concern about eql on 13.12
First take 25% pn FTA around 17 and expext for test high

TIA inteligentassetBullish scenario
Resistances 14, 16 in 50 ema, 19.1
Bearish scenario
Supports 11.63, 7.1 M pattern target

short TIACelestia broke through the support level. The bearish movement to support level at $8.89 is expected to happen.

TIA LONG based on visible W formation
The Chart shows a Resistance at 14.36 slightly below the 50 EMA and also closed to the Day's Open .
If the Resistance does not hold then we are looking towards a SHORT which would be temporal lived until 14.10 or close to the M1 position.
There is a strong SELL/BUY (MM).
This shows a cool W formation ready to be missed!

TIAUSDT Technical AnalysisGreetings, traders and crypto enthusiasts! 📈 Today, let's dive into the technical analysis of TIAUSDT (Tianya Token against USDT) to uncover potential trends and strategic trading opportunities. By examining key indicators and patterns, we aim to provide insights that can assist in making informed trading decisions. Join us as we navigate through the charts to unravel the trajectory of TIAUSDT.
🔍 Analyzing the technical landscape of TIAUSDT allows us to gain valuable insights into its price movements and potential trends. Let's explore the essential technical aspects to understand the current market dynamics.
Title: "TIAUSDT Technical Analysis: Unveiling Potential Trends for Strategic Trading"
Introduction:
Greetings, traders and crypto enthusiasts! 📈 Today, let's dive into the technical analysis of TIAUSDT (Tianya Token against USDT) to uncover potential trends and strategic trading opportunities. By examining key indicators and patterns, we aim to provide insights that can assist in making informed trading decisions. Join us as we navigate through the charts to unravel the trajectory of TIAUSDT.
Technical Overview:
🔍 Analyzing the technical landscape of TIAUSDT allows us to gain valuable insights into its price movements and potential trends. Let's explore the essential technical aspects to understand the current market dynamics.
Key Indicators:
1️⃣ Price Action Analysis: Evaluate recent price movements and patterns to identify potential trends and market sentiment. Look for patterns such as higher highs and higher lows (uptrend) or lower highs and lower lows (downtrend) to gauge the prevailing direction.
2️⃣ Volume Analysis: Assess trading volumes to confirm the strength of price movements. Higher volumes during upward movements indicate increased buying interest, while higher volumes during downward movements suggest heightened selling pressure.
3️⃣ Support and Resistance Levels: Identify key support and resistance levels based on historical price data. These levels often act as barriers to price movements and can provide valuable insights into potential reversal points.
🎯 Critical Support and Resistance: Highlight significant support and resistance levels that have historical significance. These levels may influence price action and serve as potential entry or exit points for traders.
Keep an eye on potential breakout opportunities above resistance levels or below support levels. Breakouts can signal shifts in market sentiment and provide trading opportunities for strategic traders.
🛡️ Implement effective risk management strategies to mitigate potential losses. Consider setting stop-loss orders, diversifying your portfolio, and avoiding over-leveraged positions to manage risks effectively.
TIAUSDT's technical analysis provides valuable insights into potential trends and trading opportunities. By understanding key indicators and patterns, traders can make informed decisions and capitalize on profitable trends in the crypto market.
Disclaimer: This analysis is for informational purposes only and should not be considered financial advice. Always conduct your research and consult with a financial advisor before making investment decisions.
#TIAUSDT #TechnicalAnalysis #CryptoTrading #SupportAndResistance #VolumeAnalysis #BreakoutOpportunities #RiskManagement #Cryptocurrency #Blockchain #TradingView

what next for $TIA?well as you can see in the chart below we fell down from a bearish rising wedge and got its target of $14.91; by touching again this static resistance that I highlighted with yellow for you, it was made a double button can make a W pattern and get $24.9 if we'll complete pattern and retest $19.96 then we go $24,9. Else if rejected from the 19.96 area and won't break $21.14 it will make a head and shoulders and have the potential to fall to the $8.71 area. I should mention it has a big divergence in Daily TimeFrame RSI and has made a bullish flag pattern in RSI; one of our confirmations for a bullish scenario can be breaking this flag and retesting this. let's appose you haven't bought any Tia yet. What should I do? nobody knows what will happen so do DCA. Assign how much you see matches your Money management strategy and stake it. ( try to have at least 10) #DYOR #NFA

TIA long hello Traders, here is the full analysis for this pair, let me know in the comment section below if you have any questions, the entry will be taken only if all rules of the strategies will be satisfied. I suggest you keep this pair on your watchlist and see if the rules of your strategy are satisfied. Please also refer to the Important Risk Notice linked below.

TIA infohere's my view on LSE:TIA in terms of T.A
use info to complement your own T.A
not to follow blindly

TIA/USDTBINANCE:TIAUSDT
This idea has a medium-term profit target.
All targets are indicated on the graph.
- Risk 1% on deposit
- R/R 1/2
P.S (This is not an investment recommendation, this is my personal opinion.)

TIA is at the key Support zoneTIA is at the key Support zone
🔵Entry Zone 13.72 - 14.07
🔴SL 12.3444
🟢TP1 15.0352
🟢TP2 16.7800
🟢TP3 18.5288
Risk Warning
Trading Forex, CFDs, Crypto, Futures, and Stocks involve a risk of loss. Please consider carefully if such trading is appropriate for you. Past performance is not indicative of future results.
If you liked our ideas, please support us with your likes 👍 and comments.

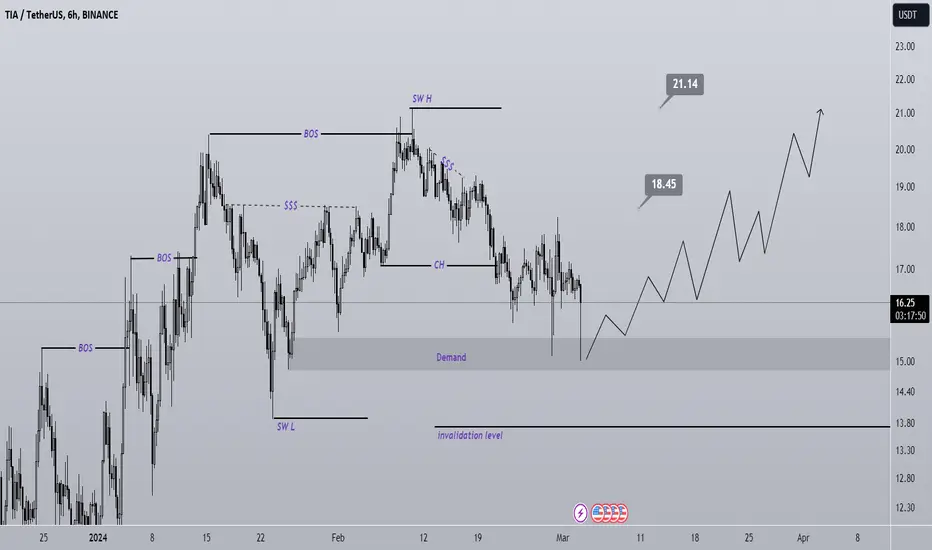
TIA has reached a valuable rangeTIA has reached a valuable range. By maintaining the specified demand, it can move towards the specified targets on the chart.
Closing a daily candle below the invalidation level will violate the analysis.
Note that the financial market is risky, so:
Do not enter any position without confirmation and trigger.
Do not enter a position without setting a stop.
Do not enter a position without capital management.
When we reach the first TP, save some profit and try to move the stop continuously in the direction of your profit.
If you have any comments please post them, comments will help us improve our performance
Thanks
TIA: buy in low level📊Analysis by AhmadArz:
🔍Entry: 15.79
🛑Stop Loss: 14.86
🎯Take Profit: 16.71-17.48-18.24
🔗"Uncover new opportunities in the world of cryptocurrencies with AhmadArz.
💡Join us on TradingView and expand your investment knowledge with our five years of experience in financial markets."
🚀Please boost and💬 comment to share your thoughts with us!


TIA: Trendline BreakoutTrendline Breakout ( Daily Chart ). Strength in the Background : Hidden Bullish Divergence.
.....................................................................................................................
We are not registered or licensed in any jurisdiction whatsoever to provide investing advice or anything of an advisory or consultancy nature.
and are therefore are unqualified to give investment recommendations.
Always do your own research and consult with a licensed investment professional before investing.
This communication is never to be used as the basis of making investment decisions, and it is for entertainment purposes only.

TIA ANALYSIS (6H)From where we entered start on the chart, we have had a symmetric, now we seem to be in the F wave of this symmetric, and it is expected to start from the green area of the bullish wave G of this symmetric and move towards the targets.
Closing a daily candle below the invalidation level will violate the analysis.
For risk management, please don't forget stop loss and capital management
When we reach the first target, save some profit and then change the stop to entry
Comment if you have any questions
Thank You

long TIACelestia broke through the short-term descending trendline. The bullish trend is expected to continue and reach the resistance level at $20.6
